✨ Welcome to ReportGuru.ai Documentation
Welcome to ReportGuru.ai Documentation – your guide to understanding, mastering, and getting the most out of your data reporting. Here you will find step-by-step tutorials, tips, and resources to help you:
- Set up your account and start analyzing data quickly.
- Learn how to create custom reports, use advanced filters, and leverage all features.
- Solve common issues and get answers fast through FAQs.
- Navigate efficiently using our search and structured guides.
Learning ReportGuru.ai is simple and fast. Follow these steps to get started:
🚀 Quick Start
-
Explore the Sidebar
✅ Begin with the Getting Started section. -
Master Features
Learn about custom fields, advanced filters, and reporting options in our Knowledge Base. -
Learn at Your Pace
Watch tutorials or read guides anytime.
🔓 Unlock Your Data
When you’re ready, use your data to its full potential with ReportGuru.ai!
Note:
All screenshots and videos are from a demo account. Your privacy and data are safe!
📖 Explore ReportGuru.ai
-
🚀 Getting Started
Start your journey: learn the basics and set up quickly. -
🛠️ Knowledge Base
Dive into advanced features, custom fields, and reports.
ℹ️
Click HERE to return to the ReportGuru.ai homepage.
Try ReportGuru
📌 Getting Started with ReportGuru.ai
ReportGuru.ai makes Shopify and eCommerce reporting simple, visual, and actionable.
This guide helps you get comfortable with the interface and start building insights right away.
🛴 Navigating ReportGuru.ai
Use the navigation panel to explore different features. Each section is designed to help you manage and analyze your data with ease.
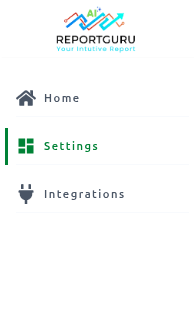
ℹ️ Navigation Panel
Your central hub to move across different sections of the app.
📔 Preset Reports
Access a wide range of pre-built reports tailored for Shopify and eCommerce.
💼 Customize Reports
Create, customize, and save reports that matter most to your business.
🔄 Data Synchronization
Sync your Shopify store and other integrations to keep your data up-to-date.
⚙️ Settings
Personalize ReportGuru.ai with your preferences and integrations.
ℹ️ Navigation Panel
The Navigation Panel in ReportGuru.ai helps you instantly move across different sections of the app.
This guide explains how each part works and how you can use it effectively.
📌 Navigation Panel Overview
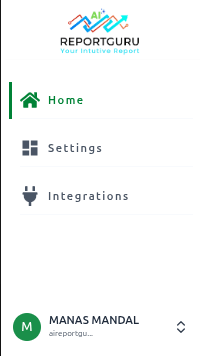
🏠 Home
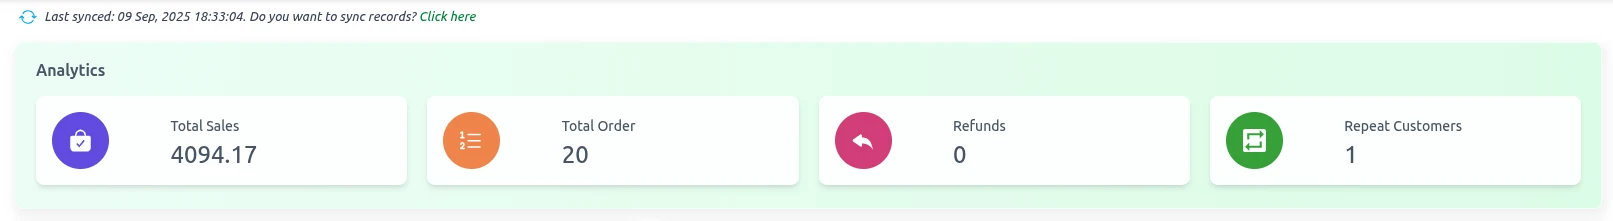
Gives you a snapshot of your store’s most important data and activities. Sections include:
- Key Metrics: Total Sales, Orders, Refunds, and Repeat Customers.
- Favorite Reports: Quick access to reports you’ve marked as favorites.
- Recent Activities: Track your most recent actions inside the app.
- Integrations Overview: See the top third-party apps connected by merchants and which ones you are using.
- Popular Reports: A curated list of reports most frequently used by ReportGuru.ai users.
⚙️ Settings
Control and customize your ReportGuru.ai account. Options include:
- Account & User Information
- Data Sync Settings
🔄 Integrations
See all available third-party applications you can connect to ReportGuru.ai.
Highlights include:
- Most Popular Apps used by the community
- Recently Added Integrations
📖 Profile
Manage and customize your ReportGuru.ai account settings. In this section, you can:
- Update Profile Information – Edit your account details and preferences.
- View & Upgrade Plans – Check your current subscription and upgrade when needed.
- Access Help & Resources – Get documentation, tutorials, and support.
- Sign Out – Securely log out of your account.
If you don’t find what you’re looking for, feel free to reach out to our support team.
🏠 Home
The Home page in ReportGuru.ai provides a quick overview of your account status, store performance, and recent activities. It’s your starting point to stay informed about reports, integrations, and key metrics.
📟 Highlights
Quickly view your store’s overall performance across key metrics, organized in easy-to-read tabs.
You’ll also see the most recent data refresh time, ensuring your insights are always up-to-date.
📜 Recent Activities
Track the most recent actions performed in your ReportGuru.ai account.
Activities are listed in descending order, ensuring your latest activity appears first.
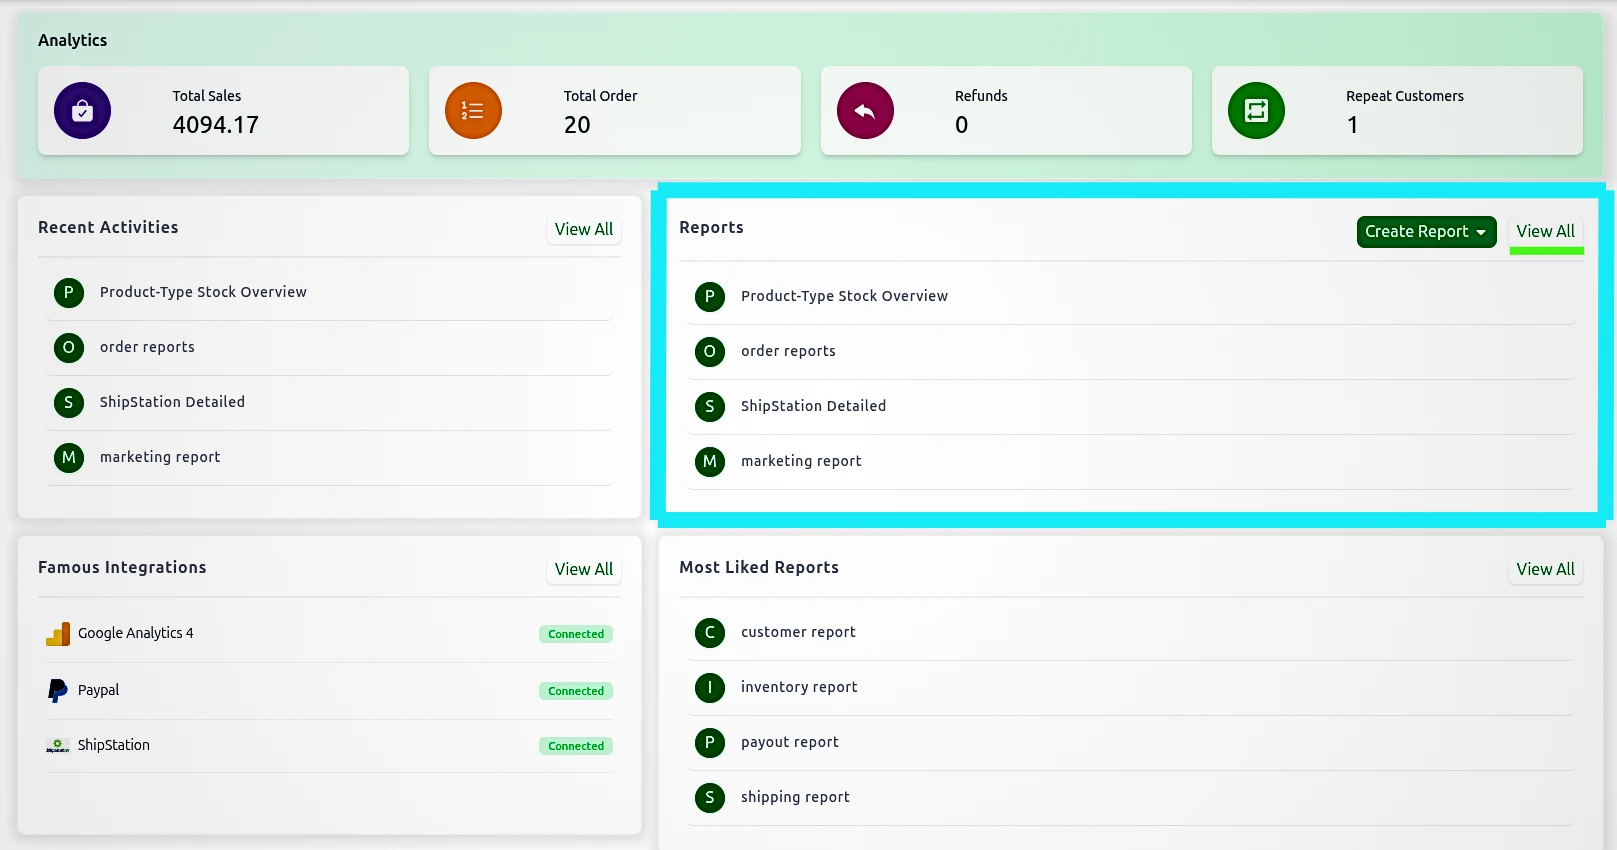
💼 Reports
Access, manage, and customize all your saved reports in one place.
You can search, edit, schedule, or mark reports as favorites for quick access anytime. For learn more click on Reports
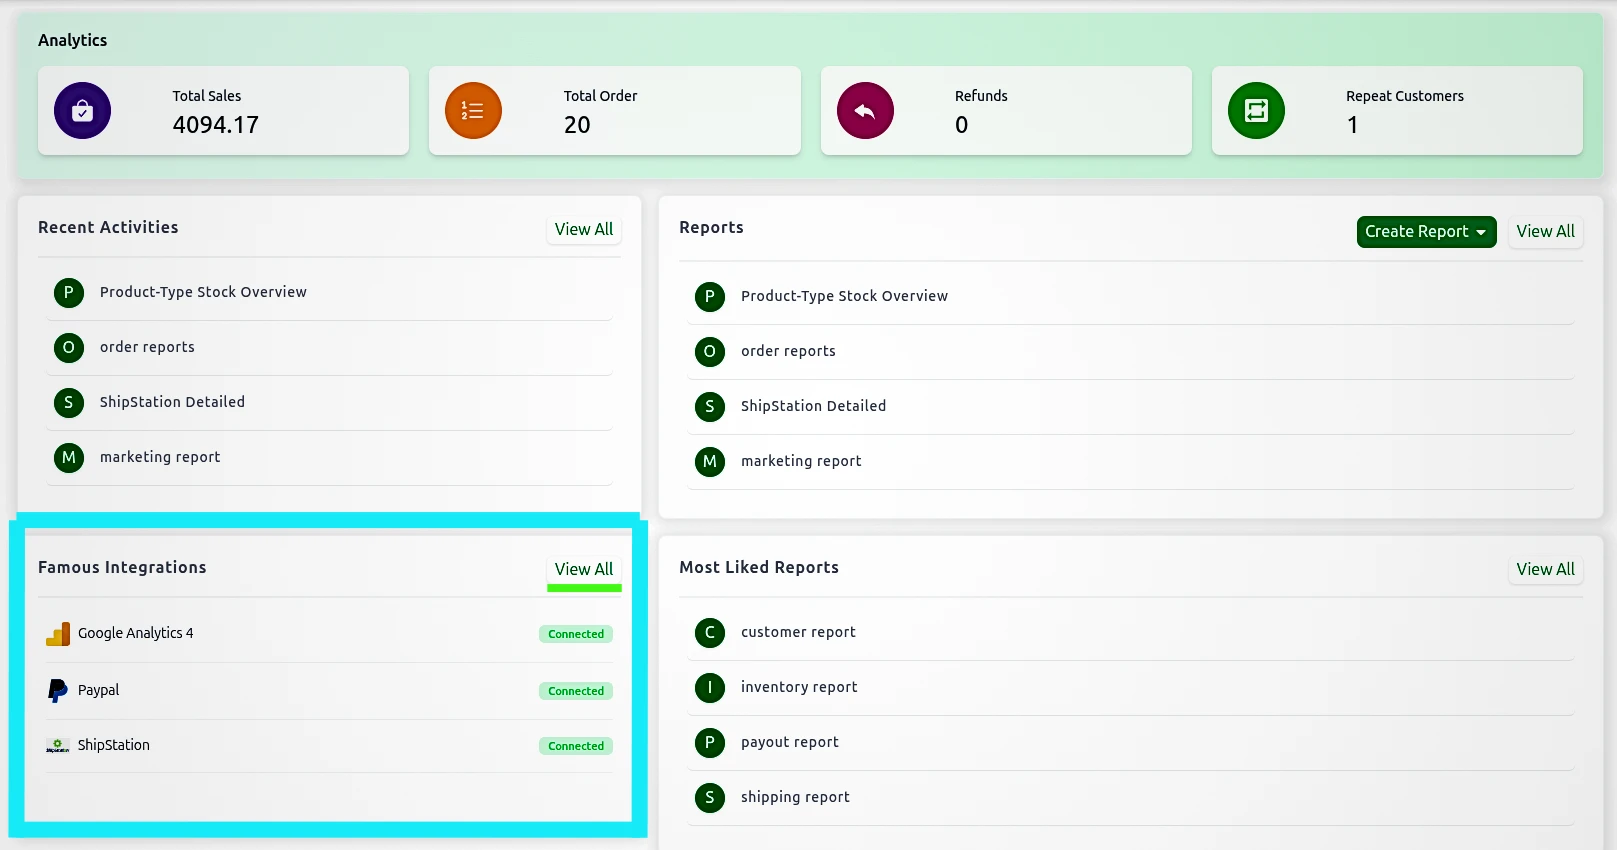
🤝 Famous Integrations
Discover trending third-party app integrations among ReportGuru.ai users. You can also check whether your account is connected to these apps.
👉 Click View More at the bottom to open the Integrations page.
💥 Most Liked Reports
Discover which reports are most frequently accessed by ReportGuru.ai users.
This section automatically highlights the reports you open most often, helping you quickly access your top insights.
👉 Click View All at the bottom to explore the complete Most Liked Reports list, or click Create Report to build a new one.
⚙️ Settings
How to Access Settings in ReportGuru.ai
You can access the Settings page directly from the left-side navigation panel in your ReportGuru.ai dashboard.
Once opened, the Settings page displays a top panel that lets you manage key aspects of your account efficiently.

⚙️ Settings Overview
In ReportGuru.ai, the Settings page contains the following options:
👤 Account
View all your personal and plan-related information in one place.
You can check details such as your profile, subscription status, and plan usage.
👉 Learn more about Account Settings

🔄 Data Sync
Control how and when your store data is synchronized with ReportGuru.ai. You can perform manual syncs or enable automatic refreshes.
👉 Learn more about Data Sync Options
👤 Account
The Account section in ReportGuru.ai lets you view key details about your store, plan, and account configuration.
This page helps you verify your active plan, Shopify connection, and registered email — all in one place.
🧭 Where to Find It
You can access the Account page by navigating to:
Settings → Account in the left navigation panel.
📋 Details Displayed in the Account Section
| Field | Description |
|---|---|
| Shop Name | Displays your Shopify store name connected to ReportGuru.ai. |
| ReportGuru Plan | Shows your current subscription plan (e.g., Free, Basic, or Premium). |
| ReportGuru Plan Expiry | Indicates when your current plan will expire or renew. |
| Shopify Plan | Displays your Shopify plan (e.g., Developer Preview, Basic, Advanced). |
| Shop Time Zone | Shows the time zone set in your Shopify account, used for time-based reporting. |
| Installer Email | The email ID associated with your ReportGuru.ai installation. This email receives important notifications and updates. |
| Shop Key | A unique identifier for your Shopify store connection. You can copy or refresh this key if needed. |
💡 Additional Options
- Receive tips & best practices on reporting & data analysis
Enable this option to get insights and suggestions from the ReportGuru.ai team on improving your analytics and reports.
🧾 Notes
- The Account section is view-only — you cannot directly modify any details here.
- For plan upgrades, go to your Profile and then open the Plans page.
- If you change your Shopify store information, updates will automatically reflect here after the next data sync.
👉 Learn more about Data Sync Options →
🔄 Data Synchronization
The Data Sync feature in ReportGuru.ai helps you control how and when your Shopify and connected data sources are synchronized.
It ensures your reports always reflect the latest store information, including orders, customers, products, and transactions.
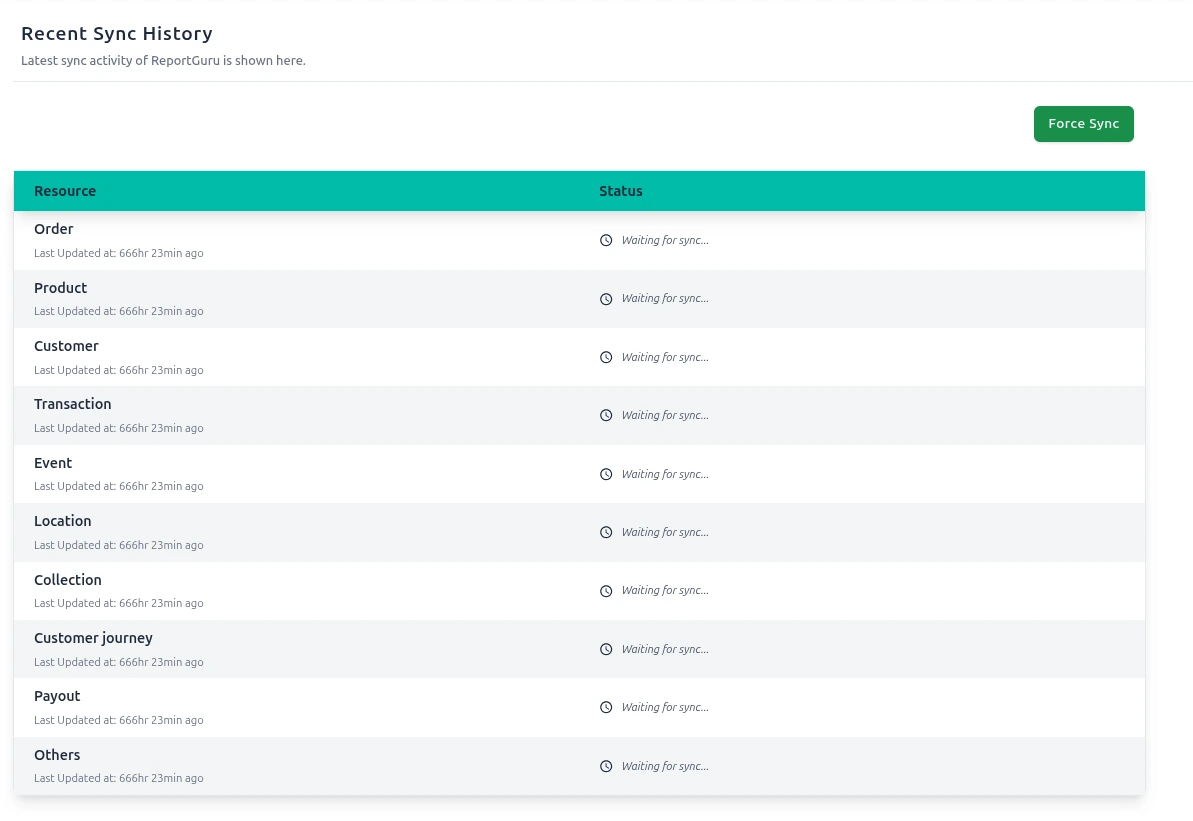
🧠 Overview
The Recent Sync History section displays your latest synchronization activity for all key data categories such as:
- Orders
- Products
- Customers
- Transactions
- Events
- Locations
- Collections
- Customer Journey
- Payout
- Others
Each category shows:
- The last updated timestamp, indicating when the data was last refreshed.
- The current status, such as “Waiting for sync…” or “Syncing”.
⚙️ How It Works
ReportGuru.ai automatically synchronizes your data at regular intervals to ensure accuracy in analytics and reporting.
You can also manually initiate synchronization when you need the latest data instantly.
🔘 Force Sync
If you’ve recently updated information in your Shopify store or connected apps, click the “Force Sync” button to trigger an immediate refresh.
This ensures your data fields (like sales totals, customer counts, or inventory details) are updated in real-time within your reports.
📊 Data Categories Synced
| Category | Description |
|---|---|
| Order | Fetches all Shopify order data including order details, totals, and fulfillment. |
| Product | Updates product titles, SKUs, categories, and variants. |
| Customer | Syncs customer information like names, emails, and order history. |
| Transaction | Pulls transaction-level data such as payments, refunds, and gateway details. |
| Event | Tracks important store events and activities. |
| Location | Updates inventory and warehouse location data. |
| Collection | Fetches product collection and category details. |
| Customer Journey | Provides insights into customer behavior and purchase flow. |
| Payout | Syncs payout and settlement information from Shopify. |
| Others | Any other relevant data integrated into your account. |
💡 Tips
- Use Force Sync before generating a time-sensitive report to ensure data accuracy.
- Sync operations may take a few minutes depending on your data size.
- Avoid triggering multiple syncs simultaneously to prevent performance delays.
- Data automatically refreshes every few hours to keep analytics up-to-date.
🖼️ Visual Reference
📚 Related Pages
🔗 Integrations
ReportGuru allows you to connect with third-party applications to enhance your reporting and analytics capabilities.
Once integrated, you can generate reports using unique data fields specific to each connected platform.
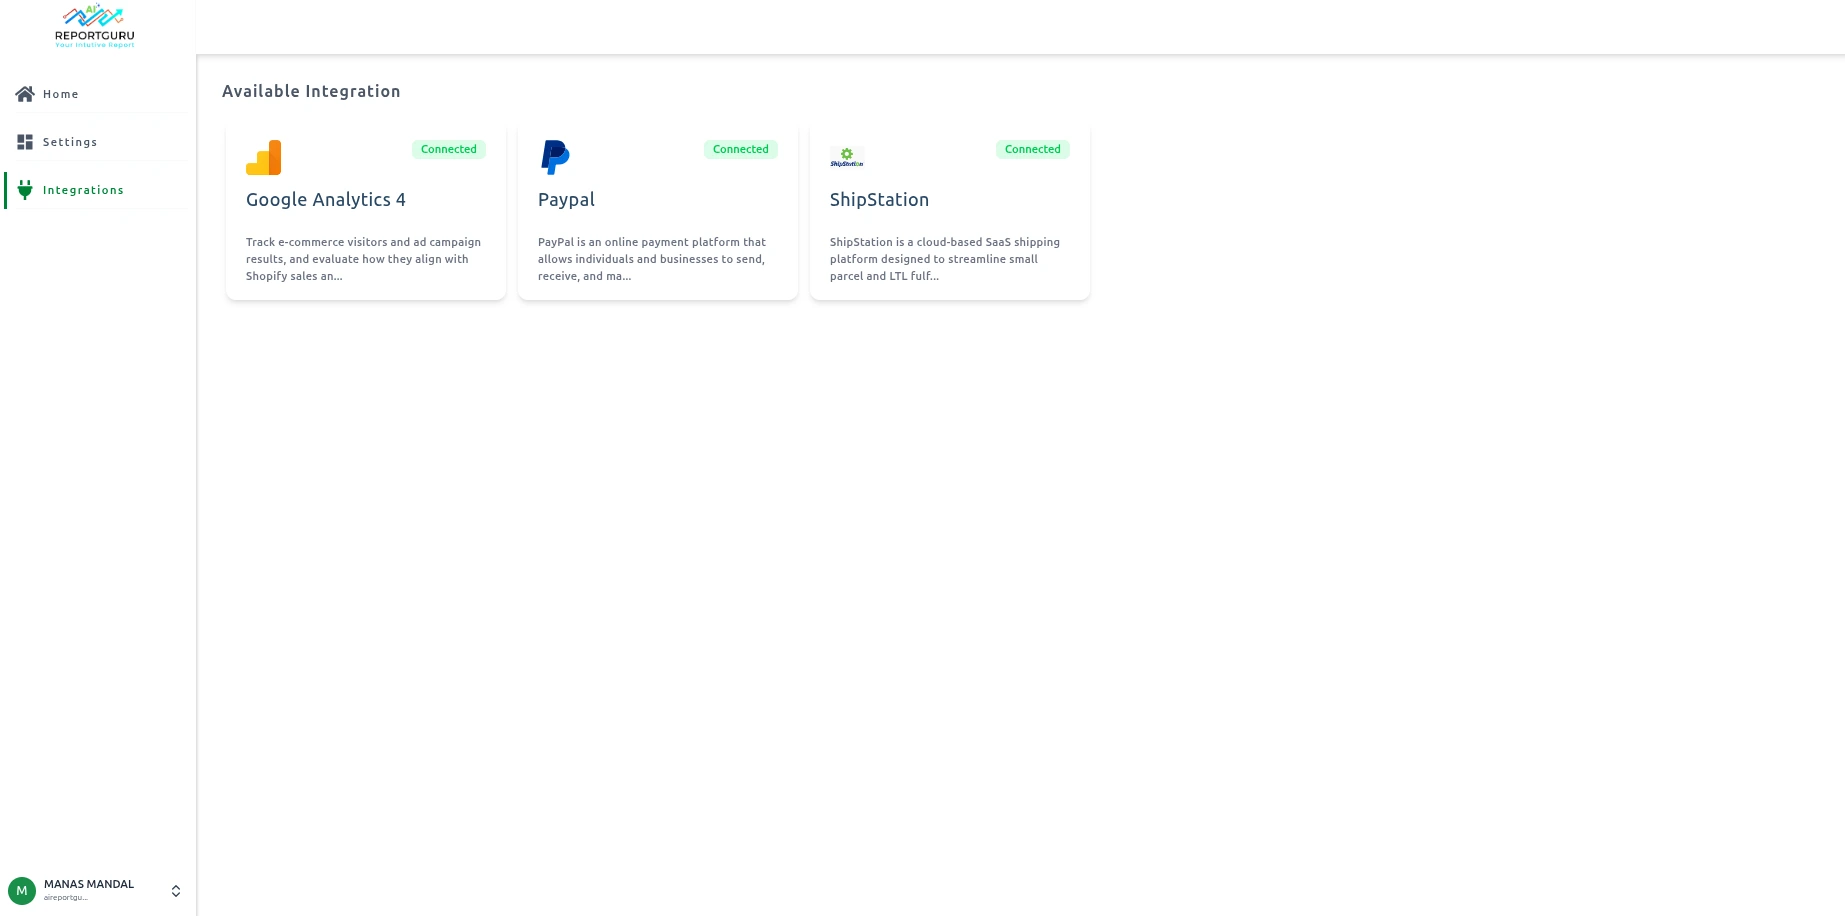
🧩 Available Integrations
| Integration | Description |
|---|---|
| Google Analytics 4 | Track e-commerce visitors and ad campaign performance, and evaluate how they align with your Shopify sales data in ReportGuru. |
| PayPal | Connect PayPal to monitor payments, refunds, and transaction summaries directly from your sales dashboard. |
| ShipStation | Integrate ShipStation to analyze fulfillment performance, track shipments, and review delivery timelines. |
ReportGuru is actively working to bring even more integrations in the future, helping you centralize insights from multiple platforms — all in one place.
💡 If you need any specific integrations, please let us know here or you can contact us — we’ll build it for you!
🧑💼 Profile
The Profile section in ReportGuru is your personal space to manage account settings, subscription plans, and support options. It helps you keep your account details up-to-date and ensures smooth access to all platform features.
From updating your name to managing billing and logging out securely, everything is accessible from one simple menu.
🔍 Where to Find It
You can find the Profile menu at the bottom left corner of the ReportGuru dashboard’s navigation bar.
Click on your name or avatar to open the profile dropdown menu.
This menu provides quick access to your account details, subscription options, and support resources.
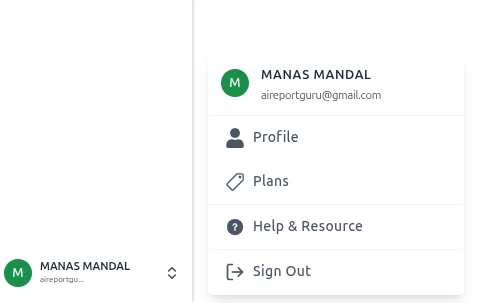
⚙️ Features
👤 Profile
View and edit your personal information such as name, email address, and organization details.
Keeping this information updated ensures that your account communications and reports are correctly personalized.
You can also review your connected workspaces or linked integrations from here.
💳 Plans
The Plans option allows you to manage your subscription and view your current billing details.
You can see your active plan, usage limits, and available upgrade options directly from this page.
It’s a convenient place to explore premium features or adjust your plan as your team grows.
❓ Help & Resource
Access the Help & Resource section for documentation, FAQs, and customer support.
Whether you need quick answers or step-by-step guidance, you’ll find detailed help articles here.
You can also reach out to the ReportGuru support team for personalized assistance.
🚪 Sign Out
Use the Sign Out option to safely log out of your ReportGuru account.
This helps protect your data, especially when using shared or public devices.
After signing out, you can easily log back in anytime using your credentials.
💡 Tip
If you manage multiple workspaces or accounts, you can switch between them from the dropdown next to your name.
This makes it easier to manage different client accounts or projects without needing to log out.
Simply click the arrow beside your profile name and select the workspace you want to access.
📊 Reports Page
The Reports section in ReportGuru allows you to easily view, manage, and organize all your generated reports in one place. From quick summaries to detailed analytics, this feature helps users access essential business data efficiently.
🧭 Reports Overview
When you navigate to the Reports section from the home page, you’ll see a clean and organized list of available reports, as shown below:
Each report entry includes:
- 🟢 Initial Icon — The first letter of the report name, color-coded for quick visual recognition.
- 📘 Report Name — The title of the report (e.g., Product-Type Stock Overview, Order Reports, ShipStation Detailed).
- ➕ Create Report — A button that lets you generate a new report directly from this page.
- 🔍 View All — Opens the All Reports page, where you can access a comprehensive list of all reports created.
💡 Tip: Each report listed here is clickable. You can click on any report name to open it directly for viewing or editing.
📄 All Reports Page
Clicking View All from the Reports section opens the All Reports page — a detailed table view displaying every report in your system.
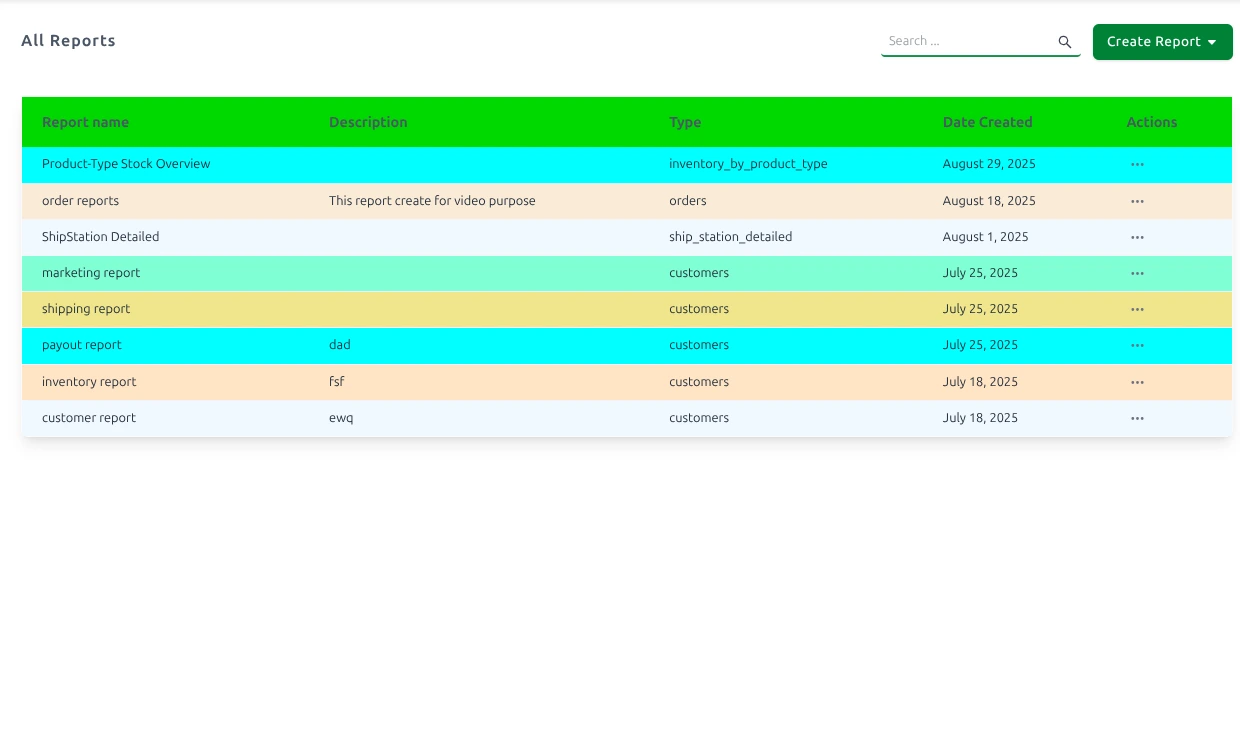
This table includes the following columns:
- Report Name — The name of the report. Each name is clickable — selecting one opens the full report view where you can review, edit, or update its details.
- Description — Additional context or notes about the report (e.g., “This report created for video purpose”).
- Type — The data source or category of the report, such as
orders,customers,inventory_by_product_type, etc. - Date Created — The date when the report was generated, helping users track updates or new additions.
- Actions — Options menu (three dots) to edit, duplicate, or delete the report.
🧩 Report Types
Some common report types include:
- Orders Reports – Summarizes all order-related data.
- Inventory by Product Type – Displays stock levels grouped by product categories.
- ShipStation Detailed – Provides shipping and fulfillment insights.
- Customer Reports – Lists customer activity or sales data.
- Marketing Reports – Summarizes performance of campaigns and channels.
✏️ Viewing & Editing Reports
Every report in both the Reports Overview and All Reports pages is interactive:
-
Click a Report Name to open its detailed view.
-
Inside the report view, you can:
- Edit report settings and filters.
- Update descriptions and report names.
- Regenerate or refresh data if applicable.
- Save changes instantly.
-
Updated reports automatically reflect in both the Reports list and All Reports table.
🚀 Creating a New Report
To create a new report:
- Click the Create Report button.
- Select your preferred report type from the dropdown.
- Fill in the required fields (name, description, type, etc.).
- Click Save to generate the new report.
- The new report will appear instantly in the Reports and All Reports lists.

🎥 See It in Action!
Experience the full flow of ReportGuru’s reporting system —
from viewing and editing existing reports to creating brand new ones in seconds.
✨ Watch the smooth process in the live demo below:
🧠 Knowledge Base
🧾 Report Creation
Welcome to the Report Creation section!
Here you’ll find detailed guidance on creating, customizing, and managing reports in ReportGuru.ai.
📖 Table of Contents
-
📄 Customized Reports
Learn how to create reports tailored to your needs. -
🔀 Sort
Organize your report data for better insights. -
⚡ Filters
Focus on the data that matters most. -
📤 Exporting Reports
Export your reports to PDF for offline use.
📝 Customized Reports
Every business is unique, with its own reporting needs. ReportGuru.ai lets you create Custom Reports tailored to your requirements.
Whether you want to build a new report from scratch or modify an existing one, this feature helps you get actionable insights quickly.
📋 Steps to Create Your Custom Report
-
Open the Create Report tool : After logging in to ReportGuru.ai, you’ll see the
 button in the Home tab. Click it and choose Custom Report from the dropdown.
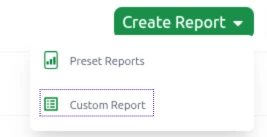
-
Name your report : Give your report a clear Name. Add a Description if needed, then click Next.
-
Choose a report category : Select your Report Category from the available options and click Create to proceed.
-
Set a date range : Use the date selector tab to pick a preset (e.g. Month of July) or enter custom start and end dates.
-
Select the data fields : Some related fields will be chosen by default. Add more via the Add Columns button. Use the search bar to quickly locate fields.
Example: Barcode (UPC), Inventory Quantity, Price.
-
Save your report : Click Save. Access all saved reports anytime by clicking View All in the “Reports” section of the Home tab.

⭐ That’s it! You’ve successfully created a customized report.
📑 Selected Fields Panel
When you click Add Columns, a pop-up window opens.
On the right side, you’ll see a panel listing all the fields you’ve already added to your report.
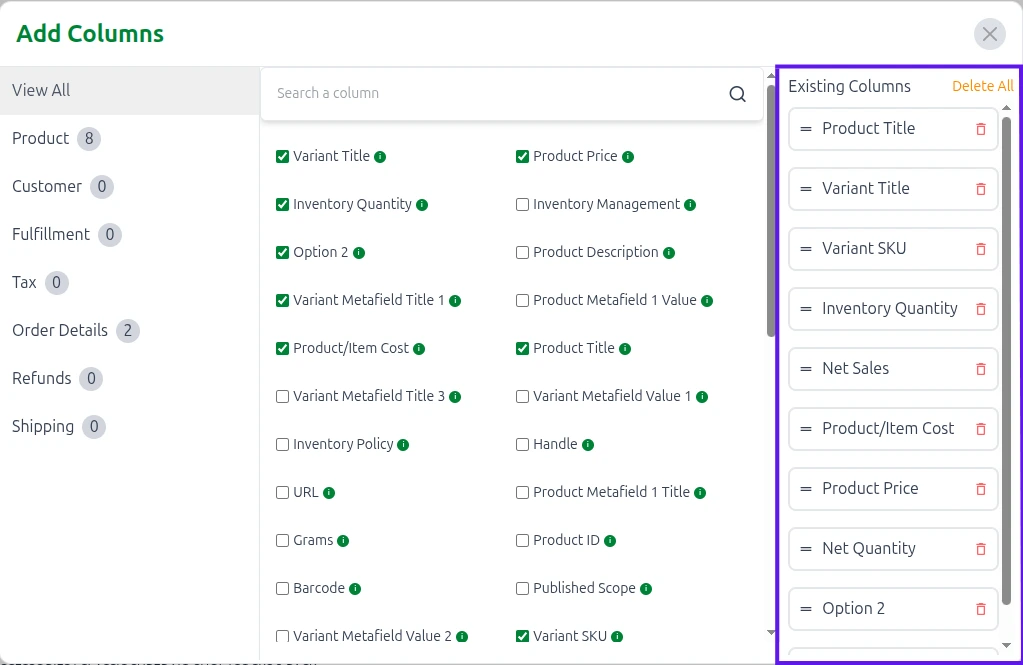
📝 What You See
-
Left Panel: Shows all available Report Types (categories).
You can switch the report type here and view every field within that type.
Fields with checkmarks are the ones currently included in your report. -
Right Panel: Displays the Selected Fields — all the columns you’ve chosen for your report.
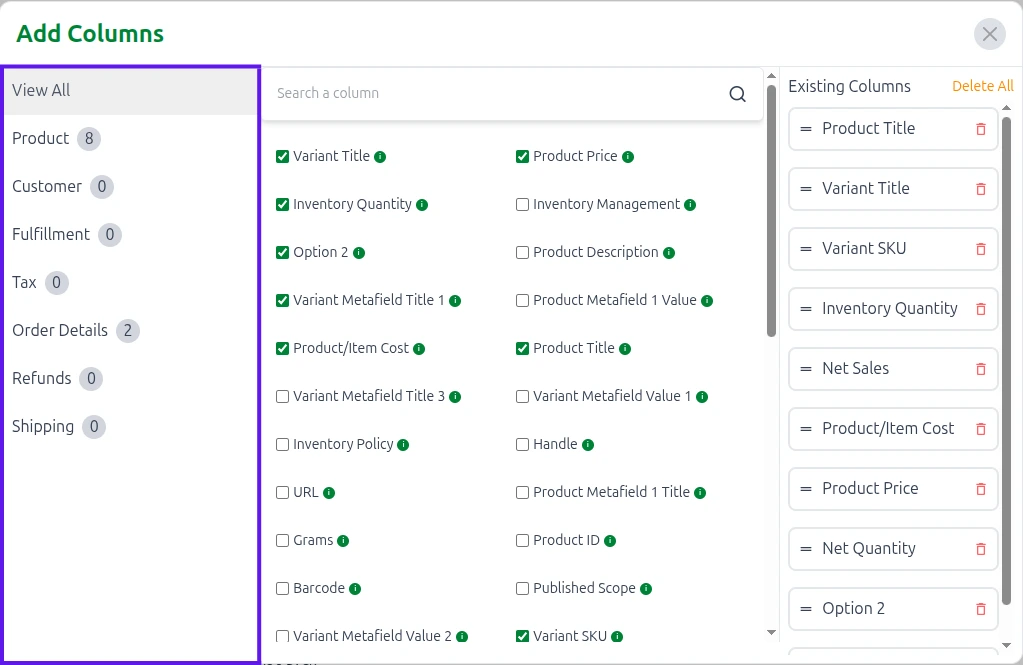
🗂 Column Typesm
- Numeric Columns: All number-based fields (for example: Discount).
- Text Columns: All text-based fields (for example: Product Name).
🔄 Reordering Fields
The selected fields are automatically organized in order.
To change the order, click and hold the two-line handle (≡) on the left side of a field, then drag it up or down to the desired position.
📔 Preset Reports
Start tracking your store’s performance from day one with 80+ ready-to-use Shopify reports.
No coding, no setup — just connect your store and get instant insights into sales, inventory, orders, and customers.
💚 Why You’ll Love Our Prebuilt Reports
- Instant Access — Connect with Shopify login and start reporting in minutes.
- Sales & Revenue — Track top products, seasonal trends, and channel performance.
- Inventory Management — Keep tabs on stock levels, restock needs, and slow-moving products.
- Customer Insights — Understand buyer behavior, repeat purchase rates, and lifetime value.
- Export with One Click — Download any report in Excel or CSV format instantly.
With ReportGuru.ai, you can customize any prebuilt report to match your exact business needs — all without spreadsheets or manual updates.
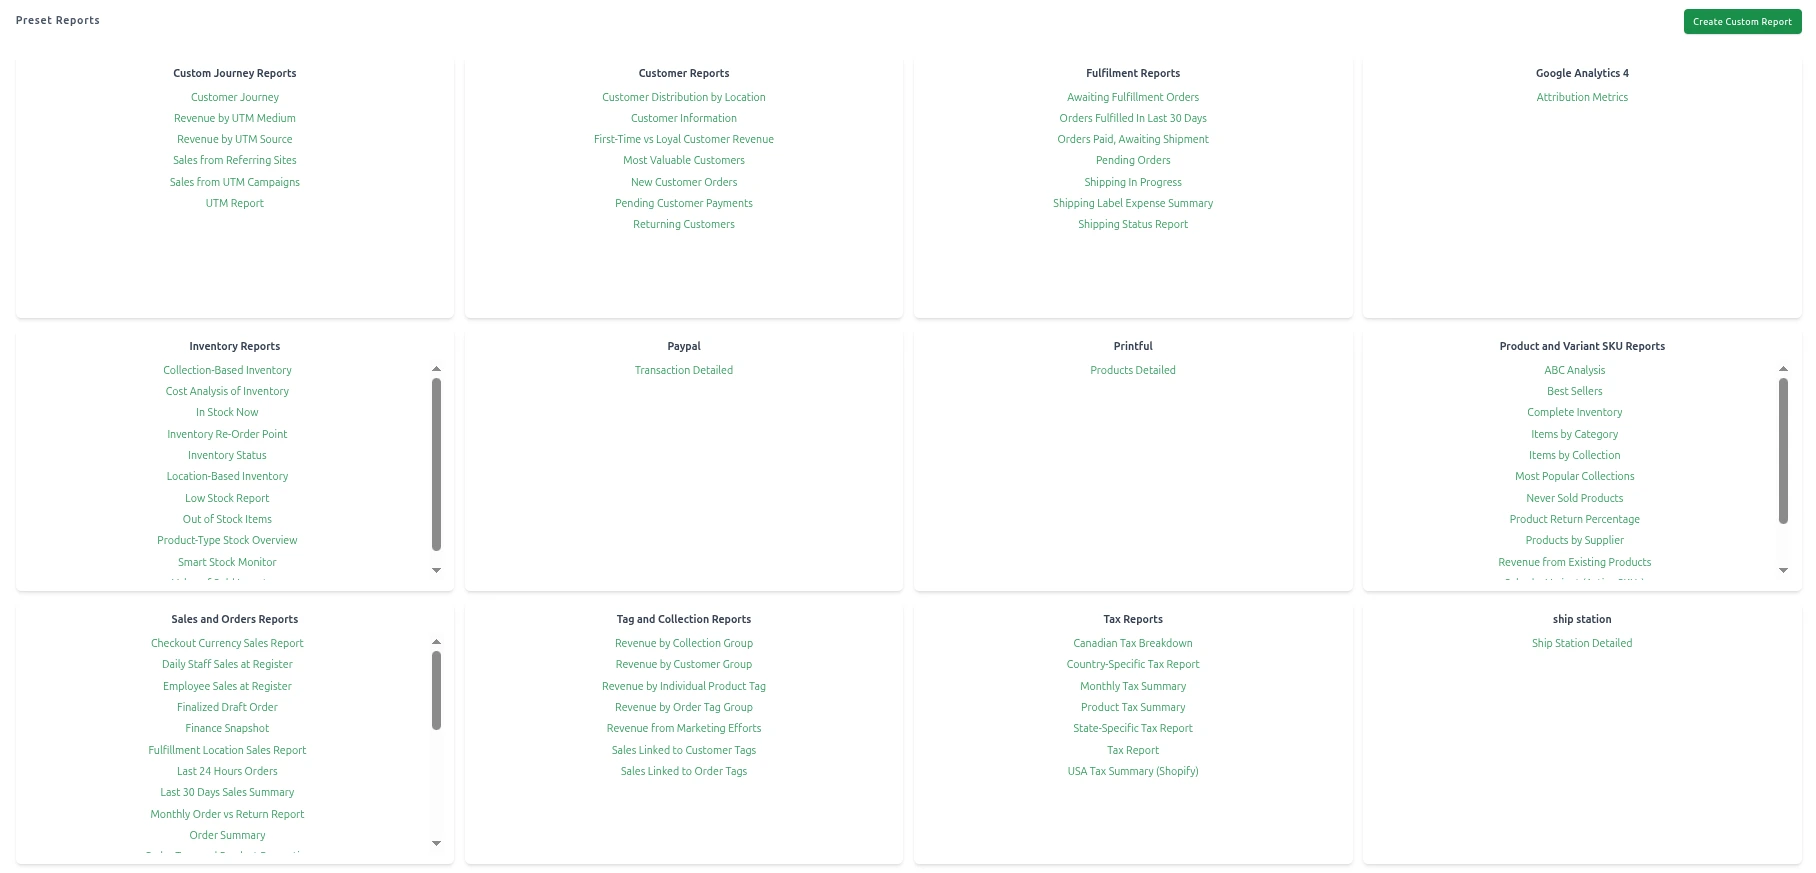
🧩 Explore Our Prebuilt Report Categories
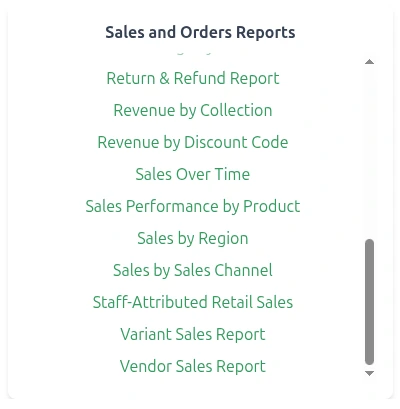
💰 Sales and Orders Reports
Track overall sales performance with detailed Shopify order data. Analyze revenue trends, seasonal spikes, and order volumes to understand what drives growth.
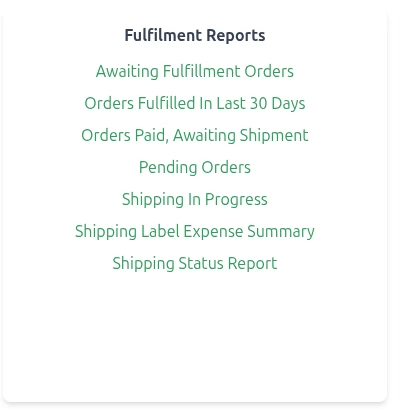
🚚 Fulfillment Reports
Measure fulfillment efficiency by monitoring shipping timelines, delivery performance, and processing delays to ensure a smooth customer experience.
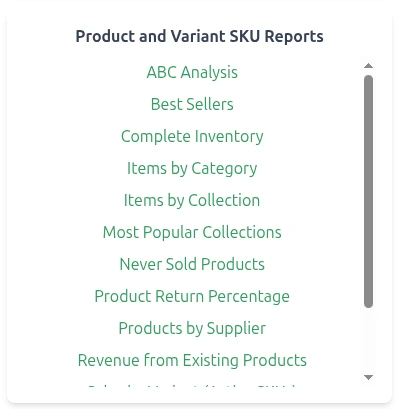
📦 Product and Variant SKU Reports
Drill down into product-level performance. Identify best-sellers, slow-moving SKUs, and uncover opportunities for targeted promotions or pricing adjustments.
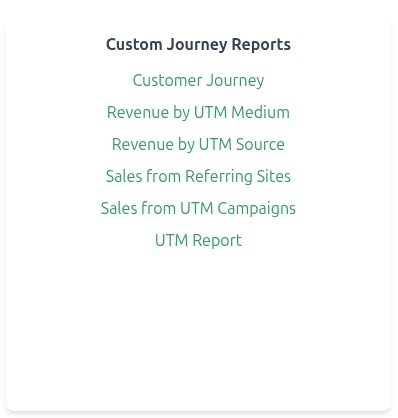
👣 Customer Journey Reports
Visualize the entire buyer path — from the first visit to checkout. Identify conversion bottlenecks and optimize the journey for higher sales.
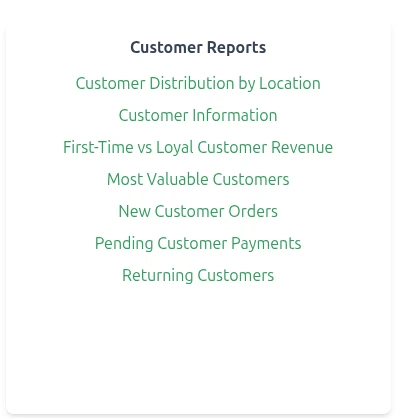
👥 Customer Reports
Understand your audience with detailed insights into customer lifetime value, purchase frequency, and buying behavior. Use this data to improve retention and targeting.
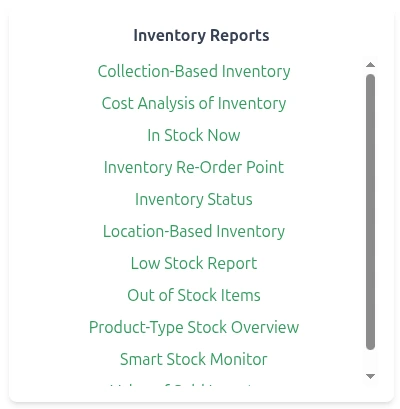
🏬 Inventory Reports
Keep track of real-time stock levels across your Shopify store. Avoid stockouts, manage restocks proactively, and optimize your inventory turnover rate.
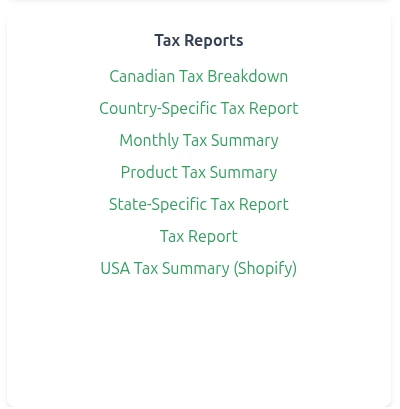
🧾 Tax Reports
Simplify tax management with clear breakdowns of collections, liabilities, and regional taxes — all synced directly from Shopify’s data.
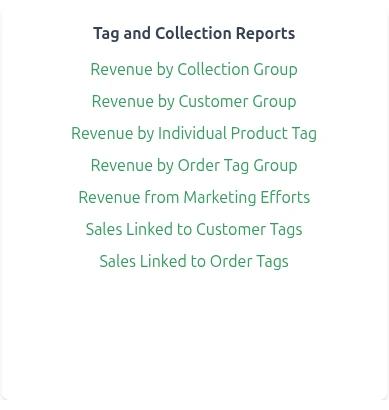
🏷️ Tag and Collection Reports
Evaluate how your product tags and collections perform. See which groupings drive engagement and conversions to fine-tune your merchandising strategy.
🪄 How to Generate a Report from Preset Templates
Let’s use Inventory Reports as an example:
- Navigate to the Inventory Reports tab in the Preset Reports library.
- Select Collection-Based Inventory from the list of available templates.
- The report will automatically load — give it a few moments to process your Shopify data.
- Once generated, click Save to store it under Reports.
- Your saved reports will always be accessible in the Reports section from the navigation panel.
🗂️ Filters
🔎 Where Can I Find the Filters?
In ReportGuru.ai, all filtering options are available in one central place — the Filters panel.
You can use this panel to refine your reports based on specific data conditions such as Contains, Not Contains, Is, Is Not, Greater Than, Lesser Than, and more.
⚙️ Filters Panel Overview

All filtering options are located in the Filters panel of ReportGuru.ai
To open the Filters panel, simply:
- Go to any report in your workspace.
- Click on the Filters icon located in the top-right of your report toolbar.
- Choose the filter type you want (e.g., Contains, Is Not, Greater Than).
- Apply the filter to instantly narrow down your report data.
📖 Table of Contents
-
🔍 Contains and Not Contains
Filter data that contains or does not contain specific text values. -
⚖️ Is and Is Not
Include or exclude exact matches for your chosen field. -
🧩 Include and Exclude
Add or remove specific data groups to refine your report results. -
🚫 Is Blank and Is Not Blank
Identify missing or populated fields in your dataset. -
🏁 Begins With and Not Begins With
Filter records based on how values start. -
🔚 Ends With and Not Ends With
Filter records based on how values end.
💡 Pro Tip
Use multiple filters together to create layered conditions — for example, filter by Product Type Contains “Shirt” and Inventory Greater Than 10 to instantly find best-selling items in stock.
🔍 'Contains' & 'Not Contains' Filters in ReportGuru.ai
Easily include or exclude records in your reports with these two powerful filter types.
✨ Contains Filter
Use the 'Contains' filter in ReportGuru.ai when you want to view only the records or fields that include a specific word or phrase.
Example:
Your store sells a wide range of apparel — Nike T-shirts, Adidas sneakers, Puma hoodies, Levi’s jeans, H&M jackets, Zara shirts, Uniqlo trousers, and more.
If you want to filter products that contain the word "NIKE", simply apply the Contains filter for NIKE.
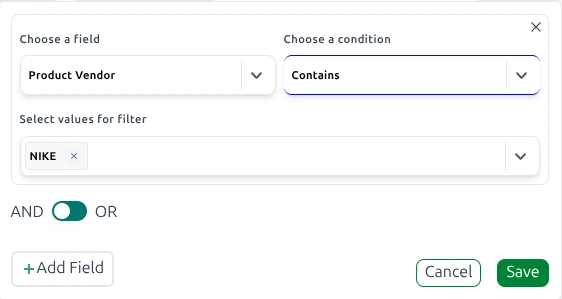
The report will now only show NIKE products such as NIKE SWOOSH PRO FLAT PEAK CAP, NIKE CRACKLE PRINT TEE, and NIKE RUNNING SHOES — all of which have the word “NIKE” in their name.
🚫 Not Contains Filter
Use the 'Not Contains' filter in ReportGuru.ai when you want to exclude any record or field that contains a specific word or phrase.
Example:
Your store sells a wide range of apparel — Nike T-shirts, Adidas sneakers, Puma hoodies, Levi’s jeans, H&M jackets, Zara shirts, Uniqlo trousers, and more.
If you apply the Not Contains filter for “NIKE”, your report will exclude all NIKE products and instead display non-NIKE items such as Adidas Ultraboost Sneakers, Puma Sport Hoodie, Levi’s 511 Slim Jeans, Zara Cotton Shirt, and H&M Denim Jacket.
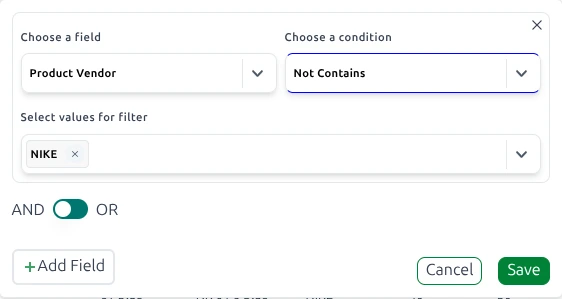
The Not Contains filter helps you instantly narrow your data by excluding specific keywords — perfect for focusing on other brands, collections, or product types without manual sorting.
💡 Tip: You can add multiple filter values with the Contains and Not Contains conditions to refine your reports even further.
🔎 'Is' & 'Is Not' Filters in ReportGuru.ai
Easily refine your reports by including or excluding records that exactly match a specific value or parameter.
✅ Is Filter
The 'Is' filter in ReportGuru.ai retrieves results that exactly match the parameter you specify.
Example:
If you apply the 'Is' filter to the Brand field with the parameter "NIKE", the report will display only NIKE products — such as NIKE Air Zoom Pegasus, NIKE Sports Jacket, and NIKE Dri-FIT T-shirt.

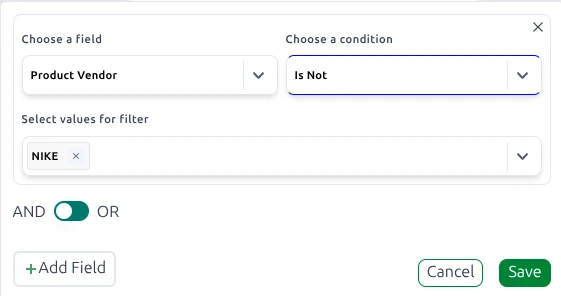
🚫 Is Not Filter
The 'Is Not' filter in ReportGuru.ai excludes results that match the specified parameter.
Example:
If you apply the 'Is Not' filter to the Brand field with the parameter "NIKE", the report will exclude all NIKE products and display only non-NIKE items such as Adidas Ultraboost Sneakers, Puma Classic Hoodie, Levi’s Denim Jacket, and Zara Cotton Shirt.
💡 Tip: You can combine 'Is' and 'Is Not' filters across multiple fields (e.g., Brand, Product Type, Order Status) to fine-tune your reports and extract exactly the insights you need.
🧩 How Do 'Include' and 'Exclude' Filters Work in ReportGuru?
✅ Include Filter in ReportGuru
The Include filter in ReportGuru.ai allows you to add multiple filter conditions to focus only on specific products, brands, or data segments in your report.
Example:
Your store sells a variety of brands — NIKE, Adidas, Puma, Zara, and H&M.
If you want to focus only on NIKE and Adidas products, apply the Include filter with the conditions “NIKE” and “Adidas”.
The report will then display only NIKE and Adidas products, such as:
- NIKE Air Max Sneakers
- NIKE Dri-FIT Sports Tee
- Adidas Ultraboost Shoes
- Adidas Originals Hoodie
All other brands (Puma, Zara, H&M) will be hidden from the results.
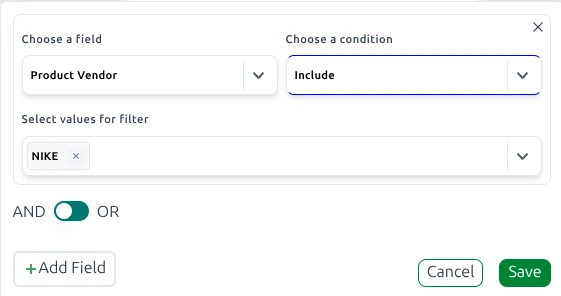
💡 The Include filter is ideal for narrowing large datasets — helping you focus on specific brands, products, or categories that matter most to your business.
🚫 Exclude Filter in ReportGuru
The Exclude filter in ReportGuru.ai is used to remove specific filter conditions from your report results, so you can analyze everything except certain products or brands.
Example:
Using the same store, if you want to exclude all NIKE and Adidas products, apply the Exclude filter with the conditions “NIKE” and “Adidas”.
The report will then remove NIKE and Adidas items and show only other brands like:
- Puma Classic Hoodie
- Zara Cotton Shirt
- H&M Denim Jacket
- Levi’s 511 Slim Jeans

💡 The Exclude filter helps keep your reports clean and focused by removing irrelevant or unwanted data — perfect for clearer brand, product, or performance comparisons.
🧾 How Do 'Is Blank' and 'Is Not Blank' Filters Work in ReportGuru?
⚪ Is Blank Filter in ReportGuru
The Is Blank filter condition in ReportGuru.ai is used to find records where a specific field is empty or has no value.
Example:
Your store lists multiple apparel products from brands like NIKE, Adidas, Puma, and Zara.
If you want to identify products missing a brand name, apply the Is Blank filter to the Brand field.
This will show only those products where the Brand field is empty — for example, items that were added to your store without assigning a brand.
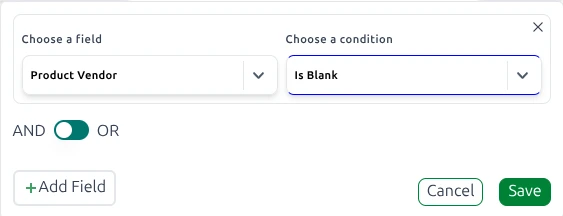
💡 The Is Blank filter is ideal for identifying incomplete product data, such as missing brand, SKU, or vendor details — helping you maintain data accuracy in your reports.
⚫ Is Not Blank Filter in ReportGuru
The Is Not Blank filter condition in ReportGuru.ai is used to find records where a specific field has data filled in.
Example:
Continuing with the same store, if you want to view only products that have a brand assigned, apply the Is Not Blank filter to the Brand field.
The report will now show only products with a valid brand name, such as NIKE Air Zoom Pegasus, Adidas Ultraboost, and Puma Classic Hoodie — effectively excluding any unbranded items.
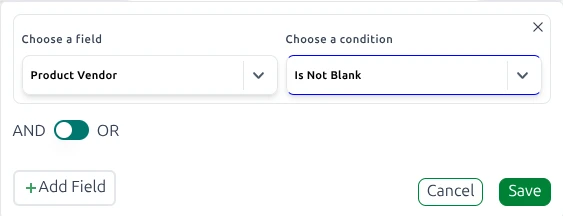
💡 The Is Not Blank filter ensures your analytics focus on complete, usable data — perfect for reports that rely on product, customer, or vendor information.
🏁 How Do 'Begins With' and 'Not Begins With' Filters Work in ReportGuru.ai?
🔤 Begins With Filter in ReportGuru.ai
The Begins With filter in ReportGuru.ai helps you find records that start with a specific prefix.
Example:
Suppose your store sells products such as NIKE Air Zoom Shoes, NIKE Running Shorts, Adidas Ultraboost, and Puma Hoodie.
If you apply the Begins With filter with the value “NIKE”, your report will display only the products that start with “NIKE” — such as:
- NIKE Air Zoom Shoes
- NIKE Running Shorts
- NIKE Sports Jacket

💡 Use the Begins With filter when you need to focus on items that share the same prefix — such as brand names, product categories, or SKU patterns.
🚫 Not Begins With Filter in ReportGuru.ai
The Not Begins With filter in ReportGuru.ai helps you exclude records that start with a specific prefix, showing all other data instead.
Example:
Using the same dataset, if you apply the Not Begins With filter with the value “NIKE”, your report will exclude all NIKE products and instead display other brands, such as:
- Adidas Ultraboost
- Puma Hoodie
- Reebok Training Tee
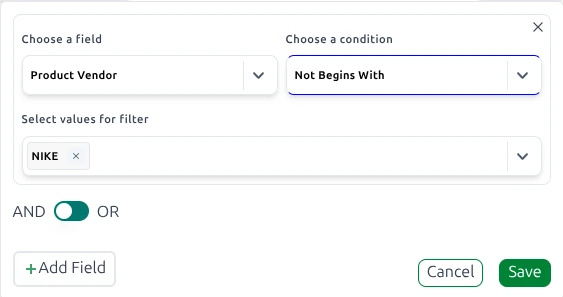
💡 The Not Begins With filter is ideal for excluding a specific brand, prefix, or series when you want to analyze the rest of your product data.
🔚 How Do 'Ends With' and 'Not Ends With' Filters Work in ReportGuru.ai?
🔤 Ends With Filter in ReportGuru.ai
The Ends With filter in ReportGuru.ai helps you find records that end with a specific suffix.
Example:
Suppose your product list includes items like Running Shorts XL, Training Pants XL, NIKE Hoodie L, and Puma Jacket M.
If you apply the Ends With filter with the value “XL”, your report will show only the products that end with “XL” — such as:
- Running Shorts XL
- Training Pants XL
- NIKE Sports Tee XL
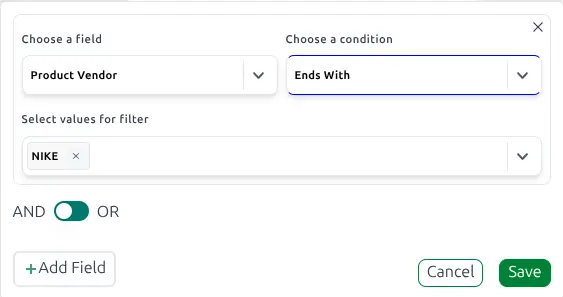
💡 Use the Ends With filter when you want to find products or SKUs ending with specific size codes, batch numbers, or suffix patterns.
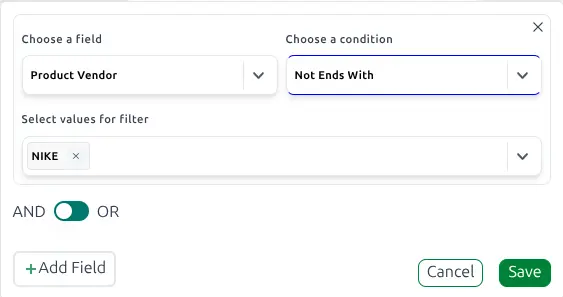
🚫 Not Ends With Filter in ReportGuru.ai
The Not Ends With filter in ReportGuru.ai helps you exclude records that end with a specific suffix, showing all other results.
Example:
Using the same dataset, if you apply the Not Ends With filter with the value “XL”, your report will exclude all products ending with “XL” and display items like:
- NIKE Hoodie L
- Puma Jacket M
- Adidas Track Pants S
💡 The Not Ends With filter is ideal when you want to remove specific variants or suffixes from your analysis — such as excluding certain sizes, series, or model numbers.
📊 Sorting Data in Reports with ReportGuru
The Sort feature in ReportGuru helps you organize your report data in the order you prefer, making it easier to analyze and gain deeper insights from your Shopify store or other business data.
⬆️ Sort by Ascending in ReportGuru
You can sort any field in ascending order, arranging values from the smallest to the largest, or in alphabetical order from A to Z.
Example:
Sorting by Variant Title will display the variants in alphabetical order — such as "3 / white", "4 / beige", "4 / black", followed by "5 / red" and "OS / white".
Additionally, you can control how many rows appear per page, with options like Top 10, 25, 50, or 100.
The Sort by Ascending option helps you quickly identify the earliest variants, lowest prices, or smallest quantities in your ReportGuru reports.
⬇️ Sort by Descending in ReportGuru
The Descending sort option allows you to arrange data starting from the highest value down to the lowest.
For text-based fields, it sorts items in reverse alphabetical order (Z to A).
Example:
Sorting by Product Price in descending order will show your most expensive products first, such as "DR MARTENS | 1461 DMC 3-EYE SHOE | BLACK SMOOTH" or "ADIDAS | SUPERSTAR 80S", followed by lower-priced products like "FLEX FIT | MINI OTTOMAN BLACK".
You can also control how many rows appear per page — Top 10, 25, 50, 100, or view all.
The Sort by Descending option is ideal for quickly spotting top-priced products, best-selling items, or highest metrics in your ReportGuru reports.
🔄 Multi-Sort in ReportGuru
With Multi-Sort, you can sort multiple fields simultaneously — each in ascending or descending order.
This allows you to create more meaningful, layered data views for deeper insights.
Example:
You can first sort Product Vendor in ascending order (A–Z) to group all ADIDAS, CONVERSE, NIKE, and VANS products together,
then sort Inventory Quantity in descending order within each group — showing the highest-stocked items first for each brand.
You can also limit the displayed rows per page to the Top 10, 25, 50, 100, or show all results at once.
The Multi-Sort feature in ReportGuru helps you build complex, insightful report views — such as seeing your products organized by brand and ranked by availability or performance.
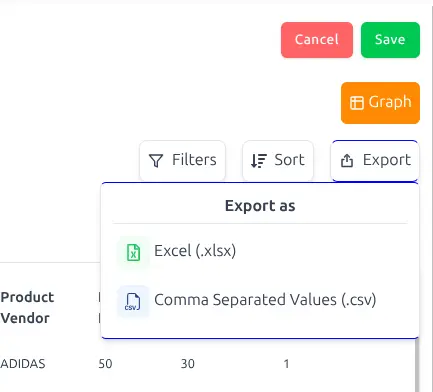
📤 Export Reports in ReportGuru
You can easily export your reports from ReportGuru to Excel (XLSX) or CSV for convenient access and sharing. Follow the steps below to ensure a smooth export process.
📘 Export to Excel (XLSX)
ReportGuru allows direct export of reports in XLSX (Excel) format.
Steps to Export:
- Open the desired report in ReportGuru.
- Click the Export dropdown menu on the export widget.
- Select Excel / XLSX as the export format.
The report will automatically download to your default folder.
📄 Export to CSV
ReportGuru also lets you export reports as CSV files.
Steps to Export:
- Open the desired report in ReportGuru.
- Click the Export dropdown menu on the export widget.
- Select CSV as the export format.
The report will automatically download to your default folder.