
In the hustle and bustle of the world of Ecommerce, running a Shopify store successfully entails much more than loading products and fulfilling orders. It calls for an intimate knowledge of your data for effective decision-making which fuels growth. Shopify reports contain a treasure trove of information about sales, customer activity, stock, and more, but using these unanalysed numbers to develop effective business strategies is never easy. That’s where analytics tools such as ReportGuru saves the day by providing an effortless means of analysing and visualizing data from your Shopify storefront. Whether you are a first-time entrepreneur who wants to establish your store or an experienced owner refining operations, learning about Shopify reports is the secret to success.
Here we will walk through the step-by-step process of turning Shopify reports into strategies that can improve the performance of your Shopify site. We will cover the basics of Shopify reports, pitfalls to avoid, and how advanced tools can be beneficial for you. Upon browsing, you will become aware about the actionable steps to put into play for your Shopify store, transforming every decision into a data-driven one. We should also keep in mind that gaining access to these insights usually begins with a simple Shopify login, where you can take a look at the backend of your Shopify online store.
Understanding the Basics of Shopify Reports
Prior to discussing strategies, it’s necessary to understand what Shopify reports are. In your Shopify store, reports are created based on different elements of your business activities. They include sales reports, which measure revenue over time; inventory reports, which keep track of stock; and customer reports, which examine purchasing habits. Although Shopify has in-built reporting capabilities, but they might be inadequate for in-depth analysis. Therefore, numerous Shopify store owners rely on third-party solutions to improve the data capabilities of their Shopify website. They also show trends such as holiday season sales spikes or failing products which require care.
A popular starting point is the sales report, which is segmented by date, product, or channel. For an expanding Shopify store, this information identifies leading sellers and improvement opportunities. Traffic reports display how customers interact with your Shopify site, guiding marketing planning. If you want to build your store from scratch, adding solid reporting capabilities up front can be a strong foundation. But raw data in Shopify support materials or standard tools usually require manual interpretation, which is time consuming. This is where converting reports into actionable insights becomes vital for any Shopify online business.
Challenges Faced While Transforming Reports into Strategies
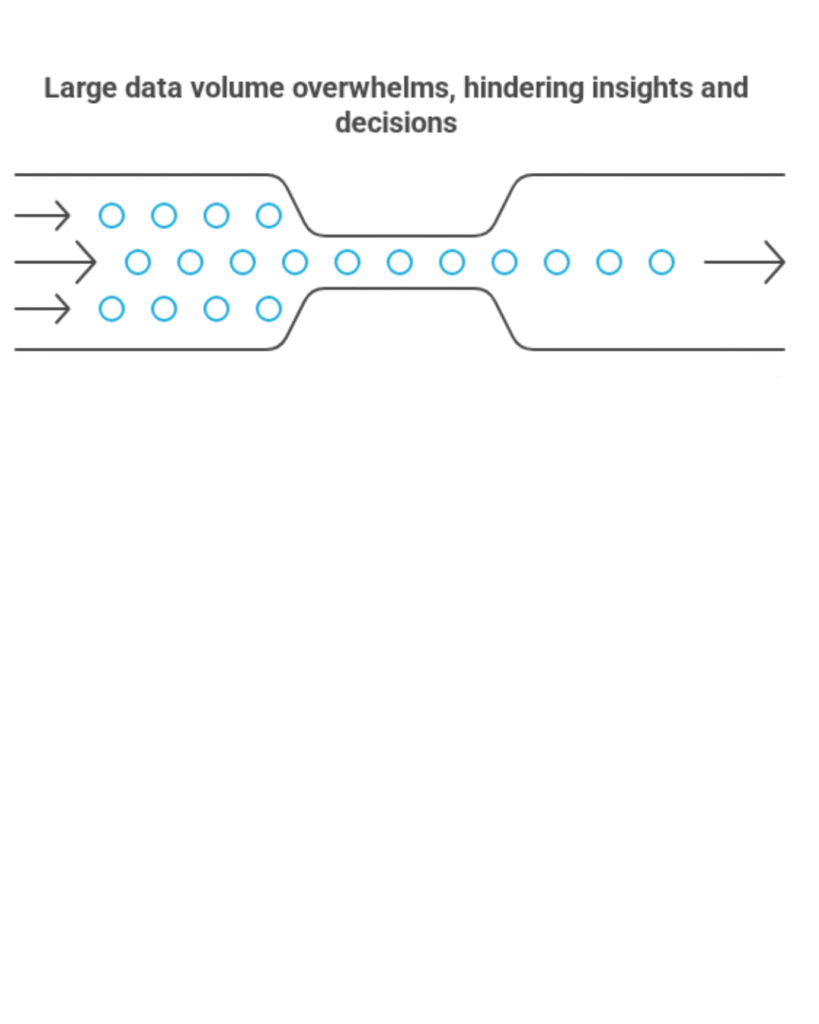
Numerous Shopify store owners face hurdles when trying to convert data into strategies as initially, the sheer volume of information can be overwhelming. Some of the common challenges faced by Ecommerce store owners are:
Extensive data: A busy Shopify website generates thousands of data points daily, from orders to refunds. Without proper tools, sorting through a hefty amount of data on your Shopify website can lead to analysis paralysis.
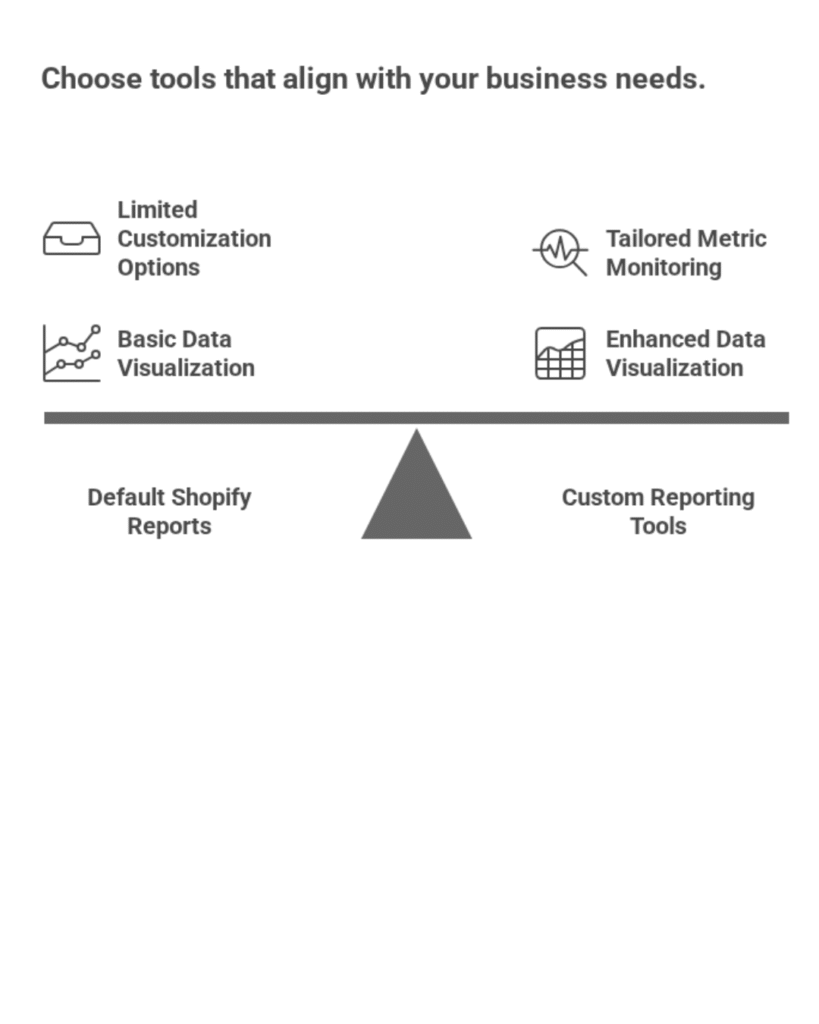
Lack of customization: Default Shopify reports may not match your individual business objectives, like monitoring custom metrics for a specialized market. Furthermore, data visualization is not always easy in the standard Shopify login interface, which makes it difficult to identify patterns.
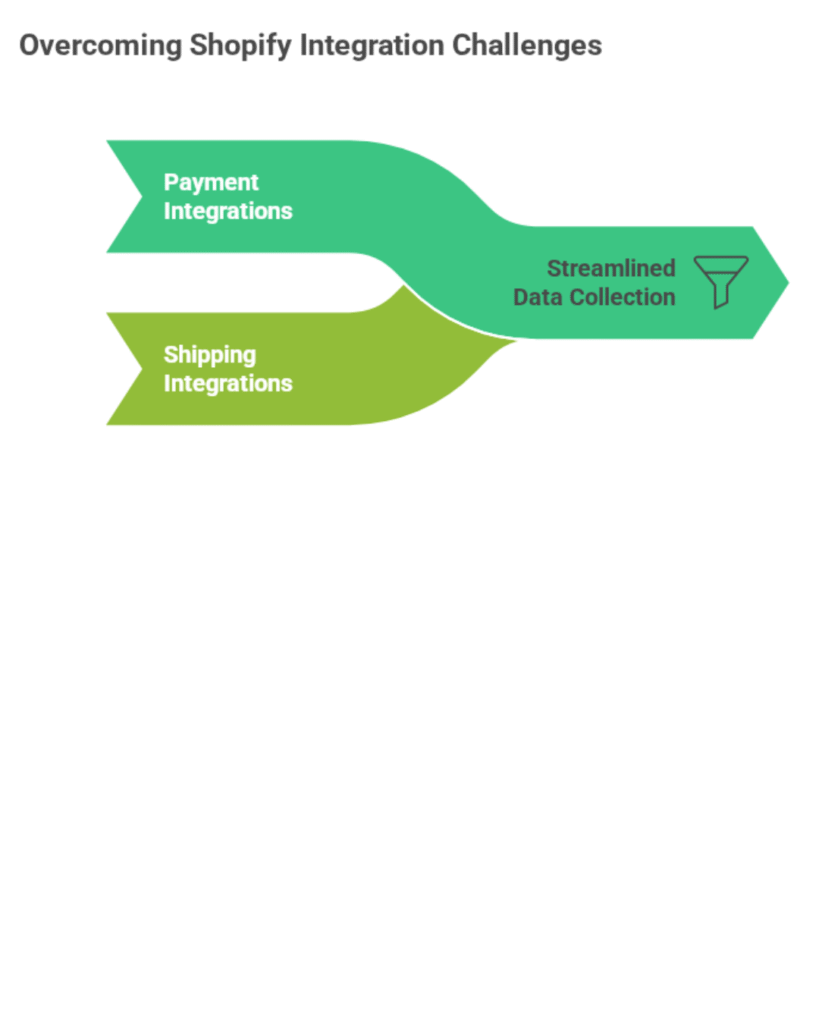
Integration centric problems: If multiple apps are being used for payments or shipping within your Shopify store, gathering data becomes complicated unless with external assistance.
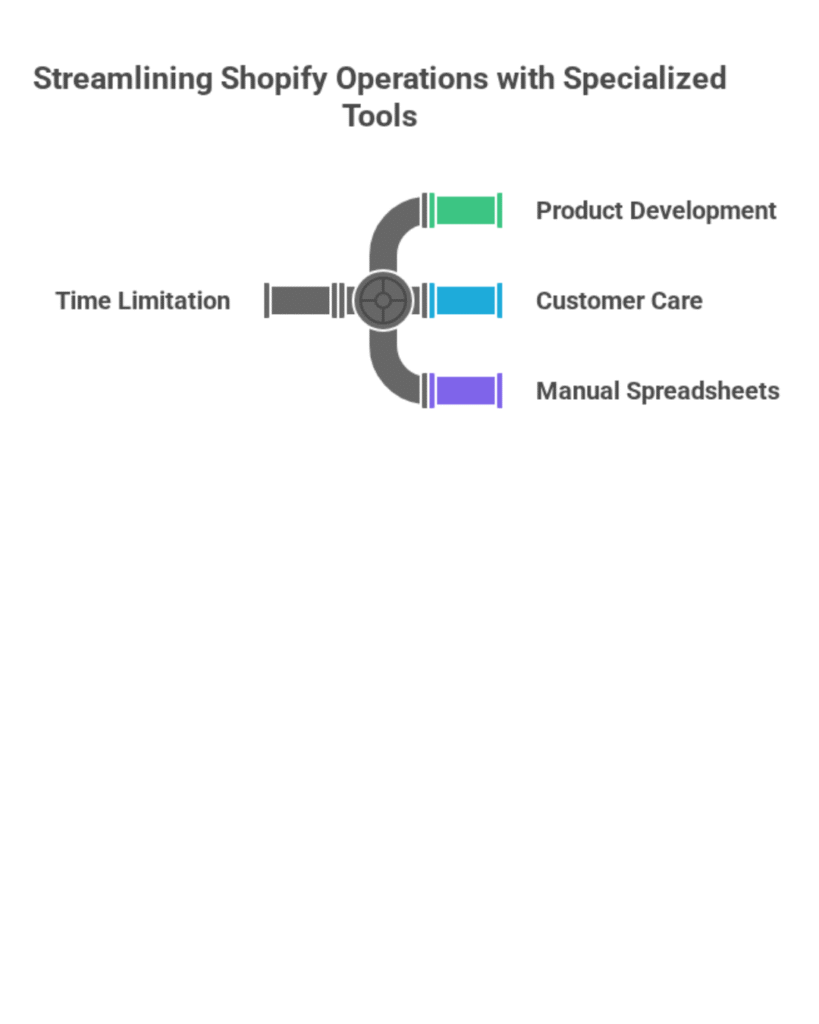
Time limitation: Consistently maintaining your store alongside making spreadsheets manually from reports takes the spotlight away from main tasks such as product development or customer care. All these challenges justify the necessity of a specialized tool to make the process easier in your Shopify store.
ReportGuru: Your Ultimate Saviour for Shopify Data Analysis
ReportGuru is a robust AI-powered tool specially developed for Shopify store owners. This platform connects the dots between raw reports from Shopify and effective strategies. It enables you to securely connect your Shopify storefront in seconds, transferring the data directly following your store. It stands out because it is based on affordable and customizable reporting. With more than 80 pre-designed reports at your disposal, you can easily create insights specific to your store. From sales by product to tax overviews, these pre-designed choices saves you from hours of tedious work.
Now, let’s break down the ways ReportGuru can help in turning Shopify reports into business strategies. The steps are as follows:
1. Connect Your Shopify Store: Start by registering on reportguru.ai and linking your Ecommerce site. The safe integration is instant, opening access to all your data without exposing it to security risks. Once connected, ReportGuru imports reports from your store for analysis.
2. Explore Pre-Built Reports: Dive into the 80+ pre-built report templates. For a new Shopify site, start with sales summaries to understand baseline performance. Customize these to fit your requirements, perhaps adding filters for specific time periods in your Shopify website.
3. Build Custom Dashboards: Build visual dashboards that call out important metrics. In your Shopify store, this may be monitoring daily sales trends or inventory turns. Visualize data using charts to simplify discovering opportunities such as upselling top-selling items.
4. Apply AI Insights: Utilize ReportGuru’s AI insights for predictive analysis. For instance, it could project demand from historical data at your Shopify store and guide stock replenishment plans. It converts static reports into dynamic plans for your Shopify site.
5. Filter and In-depth Analysis: Segment data using advanced filters. Study customer behaviour on your Shopify site by filtering repeat buyers, then plan loyalty programs. Special columns enable special calculations, such as profit margins per item.
6. Export and Share: Export reports once insights are available. Visuals can be shared with stakeholders to reach alignment in strategies. E.g., marketing campaigns for areas that underperform in your Shopify store.
7. Iterate and Optimize: Review dashboards on a regular basis. When developing your store, utilize continuous insights to optimize strategies for ongoing growth.
Following these steps can transform static reports into dynamic strategies that drive your Shopify online store to grow.

Conclusion
Converting Shopify reports into actionable business plans is no longer an intimidating process with ReportGuru. From linking your Shopify store to creating AI-powered insights, this tool is a game-changer in maintaining your Shopify website. Whether you are optimizing inventory, or scaling up operations, data becomes your best weapon.
With ReportGuru’s adjustable reports, data visualization dashboards, and professional guidance, you can establish your store on a bedrock of smart decisions. However, we should not forget that the path to your Ecommerce store’s success begins with knowing your numbers. So, log in to your Shopify store today and set out on the path towards strategic excellence.