
As a solopreneur, operating an online business is thrilling as well as challenging. It is empowering to build something on your own, but also a little overwhelming when you realize you are playing every role in your business. You are the marketer crafting campaigns, the analyst interpreting data, the inventory manager keeping stock in check, and the customer support representative answering queries even before your morning coffee.
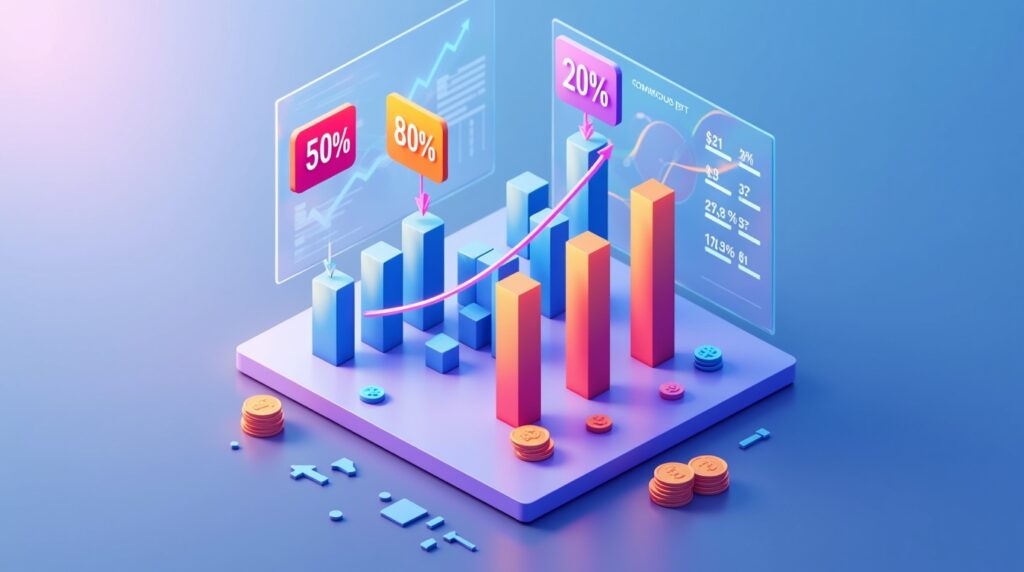
When you are handling it all, every decision matters. In such situations, ReportGuru can be an effective solution as they are not just numbers on a dashboard; they are your personal business compass. These reports present the real story behind your store’s performance: what’s working, what’s lagging, and how to progress without going beyond.
But here’s the catch, Shopify offers a sea of reports, and not all of them are equally impactful. The real magic lies in knowing which ones truly drive growth. In order to make your entrepreneurial journey smoother, here is a list of 10 must-have Shopify reports every solopreneur needs today for powerful insights that can simplify decision-making, strengthen your strategy, and push your store towards consistent success.
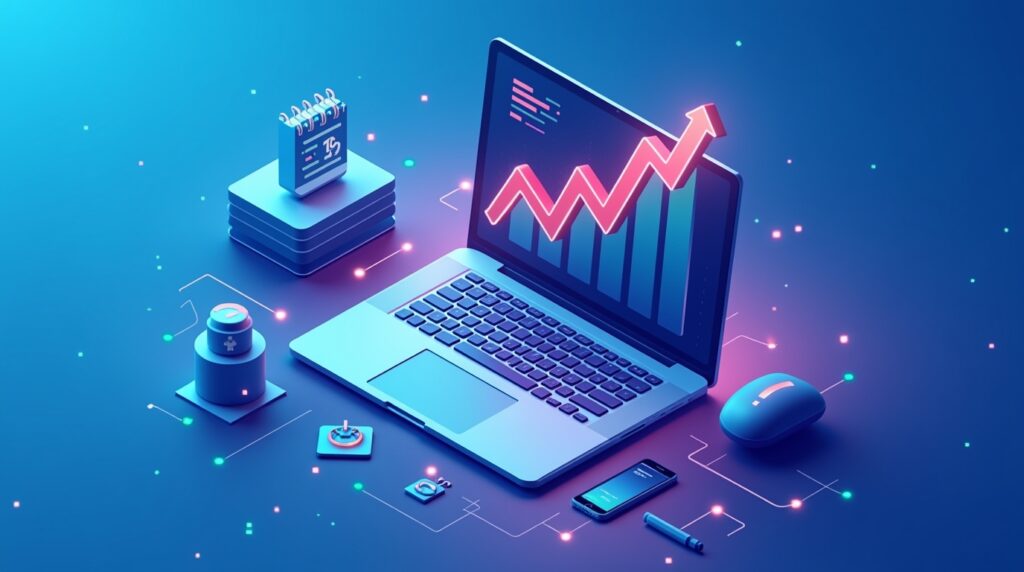
1. Sales over Time Report:
If you only review one report on a regular basis, you can stick to the Sales over Time report. It gives you a clear picture of how your business is performing over specific timeframes, i.e., daily, weekly, monthly, or even seasonally. This report helps you to answer critical questions such as:
- What is the time period of your peak sales?
- Which time periods are comparatively slower, and why?
- How are new campaigns or discounts affecting your revenue?
After browsing through this report on a regular basis, you will be able to predict the demand more accurately, understand when to replenish your products, and prepare for seasonal increases. For example, if there is a sales spike every first week of the month, then you can adjust the time period of your ad campaigns or product launches during this period.
2. Customer Journey Report:
Possessing knowledge about how your customers find and buy your products is half the battle when it comes to successful Ecommerce. The Customer Journey report maps out the complete path-from the very first click to checkout. It helps you see what channels are driving awareness, like Instagram or Google Ads, what type of content converts, like emails or product videos, and at which stage people drop off.

It can tend to be an invaluable resource for solopreneurs. You don’t have the budget for massive marketing experiments, so you need insights into what has been working. For instance, if you realize that customers who come through email campaigns convert 30% faster compared to those from social media, you may shift more focus toward email nurturing. It essentially shows the “why” behind every purchase, and also helps you refine each step of your sales funnels for smoother as well as more profitable journeys.
3. First-Time vs Loyal Customer Revenue Report:
Customer retention is the secret weapon of successful businesses. Acquiring new customers is often 5-7 times more expensive than retaining existing ones, and this report tells you exactly where your revenue is coming from.
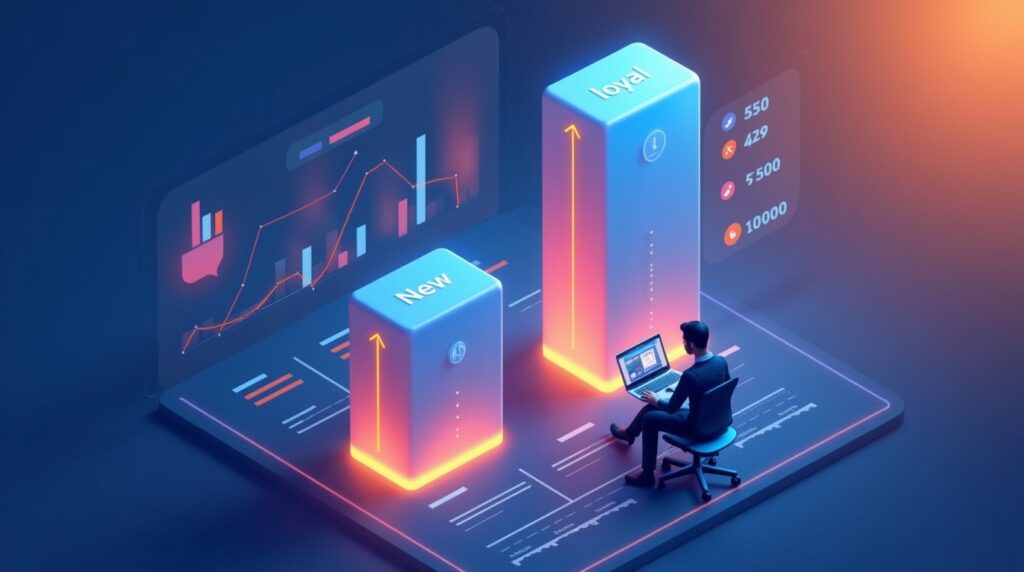
The First-Time vs Loyal Customer Revenue report splits your earnings into two key groups:
- First-time customers: The customers who are discovering your brand for the first time.
- Returning customers: The customers who already trust and love your products.
If most of your sales are from first-timers, that may be great for growth, but it also signals a need to nurture the long-term loyalty of customers. If repeat purchasers dominate your sales, it is an indication towards a strong and loyal customer base. You can also design loyalty programs, email flows, and post-purchase campaigns that can turn one-time shoppers into lifelong supporters.
4. Revenue by UTM Source Report:
Marketing without tracking is like driving with your eyes closed. The Revenue by UTM Source report tends to be a solution for that by showing which traffic sources like Google, Facebook, Instagram, or Email are bringing in the maximum revenue. Each marketing effort should have a measurable outcome, and this report lets you find out which platforms are worthy of further investment. For instance, Instagram provides you with 60% revenue, while Facebook gives you much traffic with fewer conversions. Now you know where to double down.

It is also useful for finding underperforming channels. Sometimes, a source may have high click-through rates but low sales, showing poor targeting or messaging. As a solopreneur, it is important to understand this so your limited marketing budget goes exactly where it delivers the best ROI.
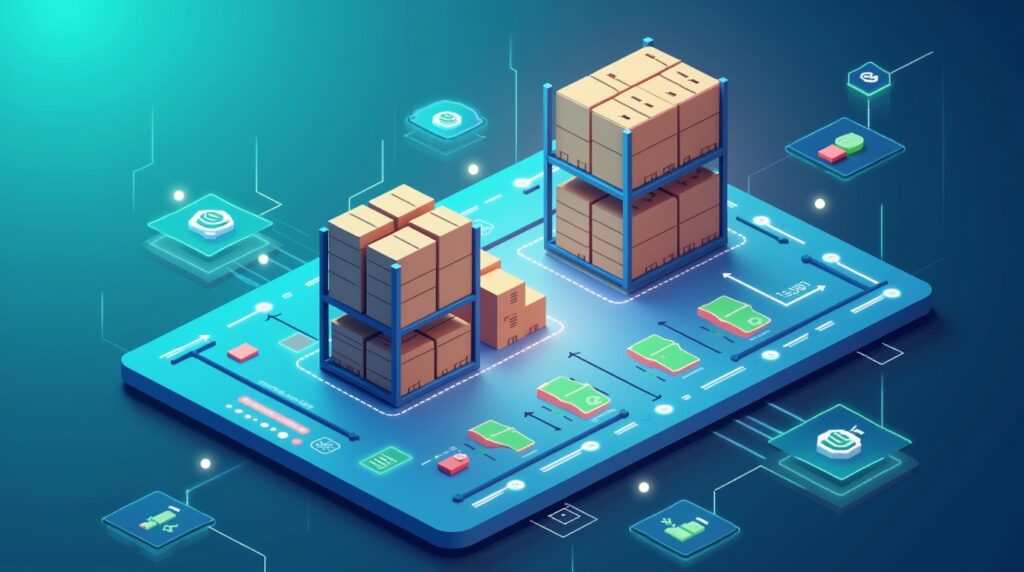
5. Low Stock Report:
When you are multitasking, inventory can easily fall between the cracks. The Low Stock Report keeps that from happening by automatically alerting you when items are running low. Imagine promoting a product on social media, only to find out it is actually out of stock. That is a loss of sales, ad spend wasted, and disappointed customers.
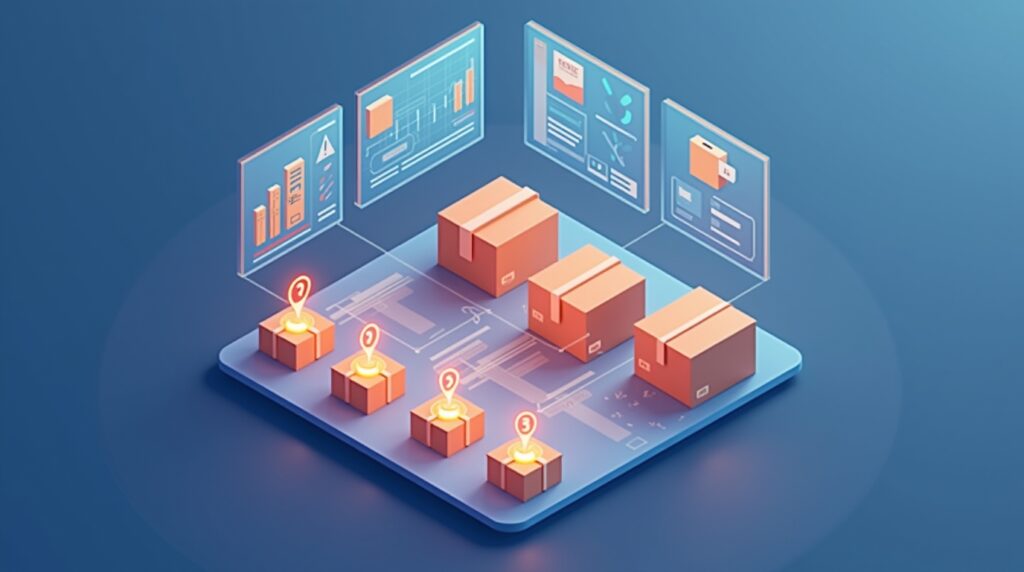
By staying ahead of the stock shortages, you can restock high-demand items in time and maintain consistent sales flow. This proves to be extra helpful in peak seasons or during sales events. Moreover, if you couple it with your Best Sellers, and you will be ahead of the game with an efficient inventory system even at your busiest hours.
6. Best Sellers Report:
Every Shopify store has those few products that steal the show, the ones customers just can’t seem to get enough of. The Best Sellers report tells you exactly what those products are, based on metrics like total revenue, units sold, or conversion rates. Knowing your best sellers is like having a cheat code to growth. You are able to:
- Prioritize them in advertisements and promotions.
- Create bundles or upsells around them.
- Use their success to inspire new product lines.
For instance, if your best-selling product happens to be a line of scented candles, then you can add similar fragrances to your line of offerings or complementary accessories. This can enhance your sales and improve brand continuity.
7. Return & Refund Report:
Returns might be frustrating, but they are also a form of feedback in disguise. The Return & Refund Report shows which products are being returned most often. Maybe customers think the colour looks different in photos, or maybe a product’s size chart isn’t accurate. Identifying these patterns enables you to fix the problems before they grow.

It also helps to improve product descriptions, packaging, and customer expectations. This report is also important in terms of financial forecasting. If some product lines show a high return rate, you can either reassess its profitability or make design adjustments. Being a solo entrepreneur, every product counts, so minimizing returns will affect your bottom line directly.
8. Revenue by Discount Code:
Promotions can be either powerful sales boosters or silent profit killers. The Revenue by Discount Code report is a visual presentation of the discount campaigns which truly add value and which ones eat into your margins. Let’s say that you ran a “Buy One Get One 50% Off” campaign and a “10% Off for New Customers” promotion. This report shows which one generated more sales, higher average order values, and better retention.
By measuring the effectiveness of your discount campaigns, you will be able to create smarter campaigns that will drive sales without hurting your profits. With the passage of time, you will learn which incentives resonate the most with your audience, helping you run promotions with purpose instead of guesswork.
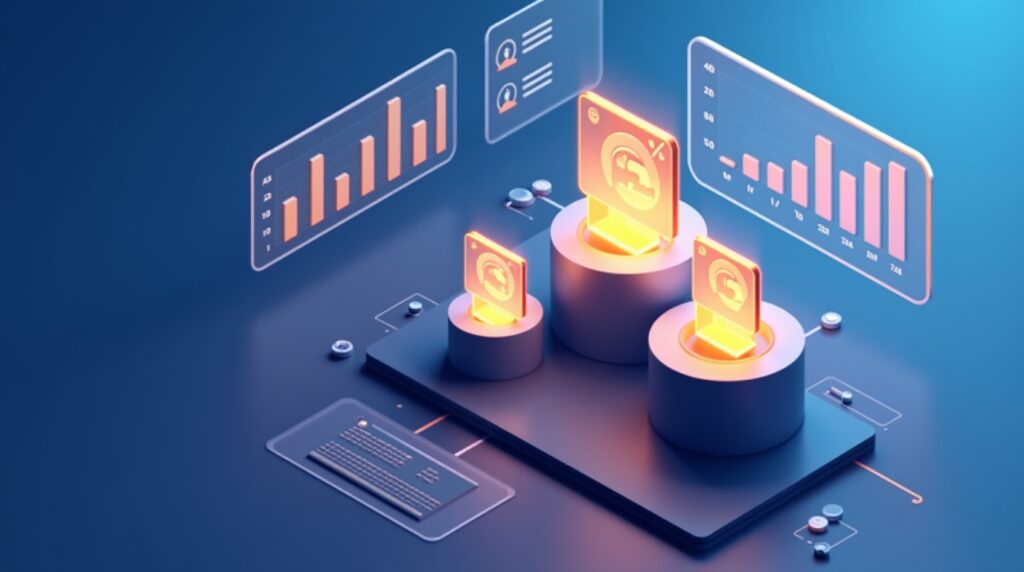
9. Most Valuable Customers:
Your best customers deserve your undivided attention. The Most Valuable Customers report identifies who they are based on total spend, purchase frequency, or average order value. This insight lets you build deeper relationships through loyalty programs, personalized offers, or early access to new launches.

You can even segment these VIPs for exclusive communication, making them feel seen and appreciated. Thus, one of the most effective growth hacks for solopreneurs is to focus on retaining high-value buyers instead of constantly chasing new ones. When your top customers feel valued, they often become the biggest advocates for your brand.
10. Smart Stock Monitor:
Inventory is like cash sitting on a shelf, if too much of it ties up your money, and too little means missed sales opportunities. The Smart Stock Monitor report helps you strike the perfect balance by showing exactly when to restock, reorder, or hold back. It consolidates key insights like current stock levels, reorder points, and product performance trends, showing you which items are being sold out fast and which are remaining stagnant, for better purchasing decisions.
For example, if the report shows you that a certain item sells out every two weeks, then you can reorder on a two-week cycle. Similarly, if another one has been sitting idle for many months, you can either provide discount on it or simply get rid of it. This level of data-driven inventory control is what separates the profitable solopreneurs from those who are constantly facing stock issues.
Conclusion
Being a solopreneur does not mean doing everything manually, rather it means working in a smarter, faster, and more efficient way. Shopify reporting tools like ReportGuru provides you the insights which big brands rely on but in a simple, visual, and actionable way. The 10 above mentioned reports cover every pillar of your business, such as sales trends, customer behaviour, marketing performance, and inventory control. If you consistently monitor these reports, you are not just running your store, you are leading it strategically. Always remember that data doesn’t have to be intimidating. The best way to start off is by picking a few reports to track on a weekly basis, and letting the insights guide your next move. Within a moderate span of time, you will start noticing a shift, from decreased guesswork to increased predictability, and a business that feels like it is running with you, and not against you.