
Operating a Shopify store in the Ecommerce ecosystem today is quite challenging. While the procedure os setting up your Shopify store can be relatively easy, but turning it into a successful and sustainable business is not only restricted to just a display of a few good products and some catchy branding. The greatest game-changer, however, is making data-driven decisions. Data-driven decisions help Shopify merchants to turn raw numbers into future growth-driving tactics simply by using analytics, reporting, and AI-fueled data insights.
Here, we will explore the ways to scale a Shopify store with data, useful advanced reporting tools like ReportGuru, and the ways a data-first approach will help you to stand out in the crowd.
Why is Data Important in Scaling a Shopify Store?
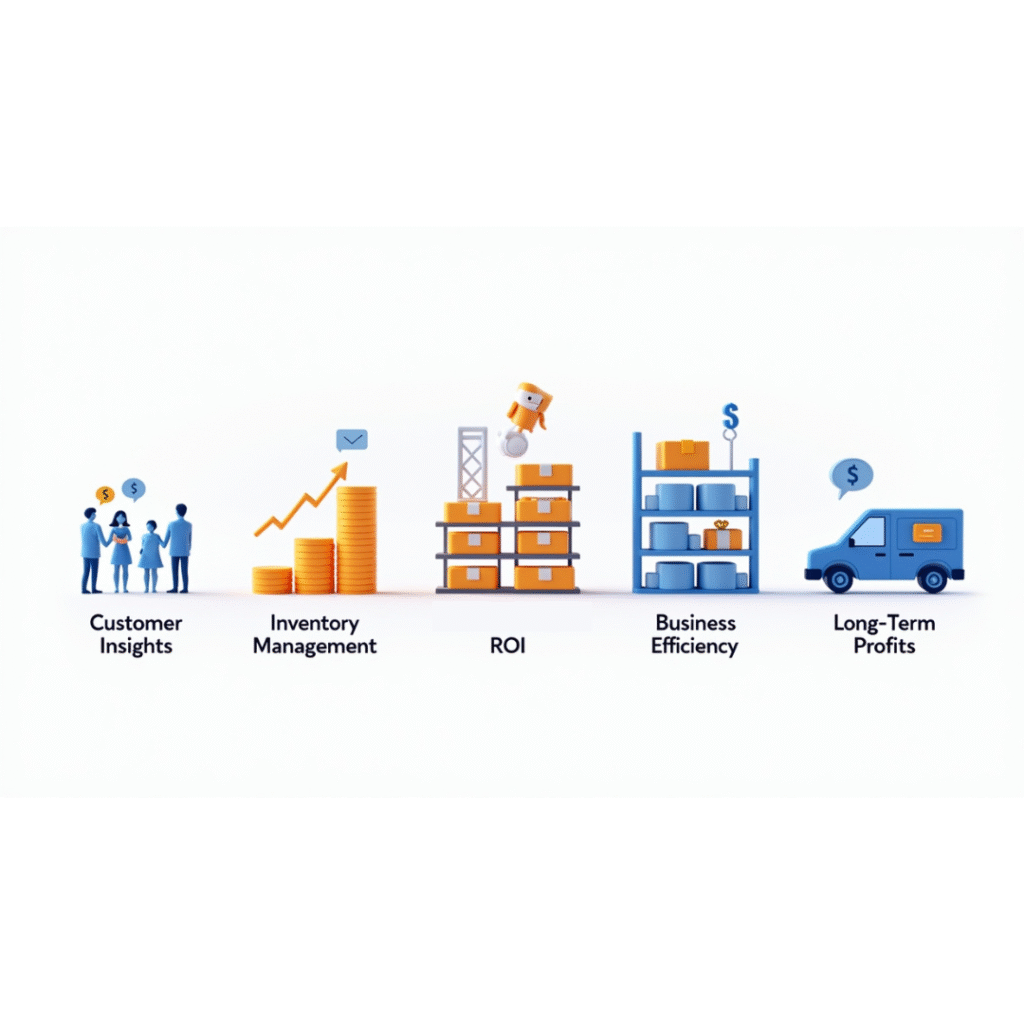
Almost every successful Shopify website is run based on research and studies, instead of just guesswork. Data provides what your customers want, their behaviours, and ultimately what can turn them into a lifelong customer. The importance of data-driven initiatives are as follows:
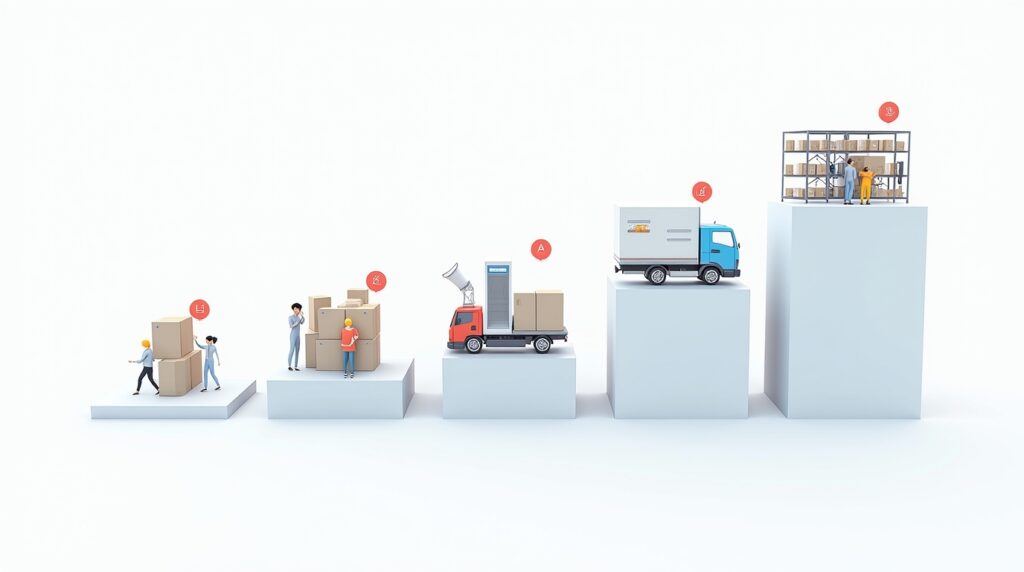
1. Better Understanding of Customers: Data provides you a better segmentation of buyers, a clear understanding of the lifetime value of buyers, which can ultimately help in creating well-placed campaigns.
2. Better Inventory Management: You will never have to worry about running out of stock, or worse dead stock because inventory data will tell you exactly when to restock, and how much to restock.
3. Better Marketing: Allocate your budgets based on ROI, not on guesswork.
4. Better Business: Data lets you enhance your fulfilment, while reducing timeliness, and helps you in establishing more satisfied customers.
5. Better Profits over Time: Monitoring key metrics will help you grow organically and will also reduce overspending.
When you start to treat your Shopify store as a data centre instead of just an online catalogue, you start making well-informed decisions that have a direct and measurable impact to your revenue.
Reporting Basics: Strengthening Your Shopify Store
The first part of leveraging data should be ensuring that you have accurate real time reports available to you. While Shopify has some solid basic in-built reporting features, but those are not enough to scale your business. In this type of scenarios, third-party solutions like ReportGuru tends to be a life-saver. With ReportGuru, you have access to 80+ prebuilt reports across sales, customers, inventory and fulfilment, all within your fingertips. There is absolutely no requirement for coding or handling complicated spreadsheets. You can just simply login with Shopify and you will be able to start analysing your business performance in no time. Some types of beneficial reports are:
1. Sales & Revenue Reports: This type of reports provide an overview of the top-selling products, the peak seasonality spikes in sales, and the sales channels providing the best ROI for your Shopify website.
2. Inventory Reports: With this type of reports, you can keep a track of the products which are in stock, forecasting product demand to know if you are going to have a stock out and to help avoiding losing sales.
3. Customer Journey Reports: This type of reports help you to trace how your buyers are moving from landing page to check-out, so you can track where people are dropping off.
4. Fulfilment Reports: This type of reports help you to measure shipping timeliness and delivery performance to improve customer experience. This helps in creating a loyal customer base for your Shopify online store.
Access to these reports on your Shopify website dashboard will give you first-hand and real time insight of the areas of potential growth.
How Custom Features Boosts Your Shopify Store?
Every business is different, meaning that whether you’re trying to keep your customers coming back for their next purchase or trying to get the most profit from your holiday sales, the goals change accordingly. There are thousands of apps in the Shopify App Store and the challenge is figuring out which ones are the best for you to analyse your data.
One such tool is ReportGuru which enables you to create customized dashboards to suit the requirements of your Shopify store. For example, if you want to compare product performance by region or have the repeat purchase rates beside your ad spend, you can now use a tool that allows you to drag and drop fields, convert currency, and put filters in. Ultimately, you can create a reporting system that reflects what you are trying to achieve as a business.
Role of AI Insights in Smarter Decision-Making
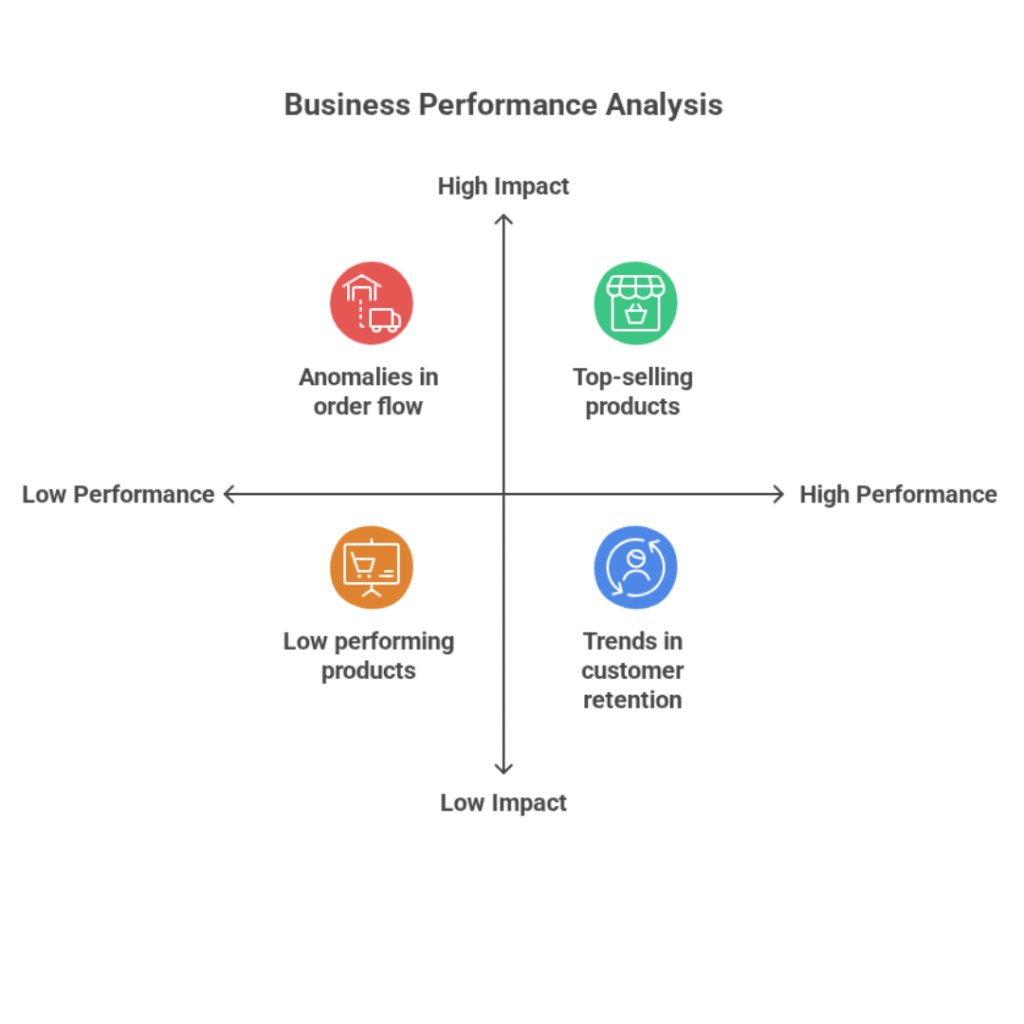
While raw numbers are critical, they can sometimes be complicated to interpret. This is where AI comes in. With valuable, AI-powered information, besides getting a report of what happened, you also receive a report of why it happened, and what to do next. ReportGuru’s AI engine pulls data from your Shopify storefront, to provide you insights. Some of them are as follows:
- Top-selling and low performing products.
- Trends in customer retention and churn.
- Seasonality of sales and inventory.
- Anomalies in fulfilment or order flow.
Instead of wading through spreadsheets, you receive actionable recommendations for your Shopify online store. For instance, if AI identifies that a product has been consistently performing well in a particular region, you can increase ad spend there. If your inventory is predicted to run out, you will receive a warning, before sales are impacted. AI’s automated analysis allows for proactive, and non-reactive decision-making, which is essential for the progression of a Shopify store.
Transforming Data into Growth Strategies
Data collection is only a part of the equation. The real value from the data comes from turning it into actionable strategies for growth. Here’s a sneak peek:
- Increase Sales from Product Insights: Review your product and SKU reports for a better understanding of the best sellers of your Shopify store. Once you become aware about those products which carry your profitability, you can create campaigns based on that data, bundle them with declining stock, and increase inventory thresholds.
- Increase Customer Experience: Customer reports include lifetime value, average frequency of purchase and churn potential. This information can help you create loyalty programs, tailor products and services directly to the customer or re-engagement campaigns. Goal-driven metrics state that a Shopify store owner sees retention backed by data with the same level of emphasis as acquisition.
- Improve Marketing Efficiency: Using data drawn from Google Ads, Facebook Ads or Email campaigns to understand ROI, and reallocating funds to channels that maximize results will increase the returns of your Shopify online store.
- Improve Operations: Back-end reports from fulfilment and taxes can help you reduce costs, improve delivery speed, and maintain compliance and order accuracy. If your back-end is functioning seamlessly, then it strengthens the credibility of your Shopify store in the eyes of the customers.
- Expand Internationally: If you’re planning to reach markets outside the local regions, cashier and tax reporting will clarify your cross-border sales, providing a transparent and structured way to ensure smooth global operations for your Shopify online store.
Automating Data for Smarter Scaling
The manual collection of weekly reports hinders growth, whereas, automation provides up-to-date data at your fingertips. Thus, with ReportGuru’s automation feature, you can:
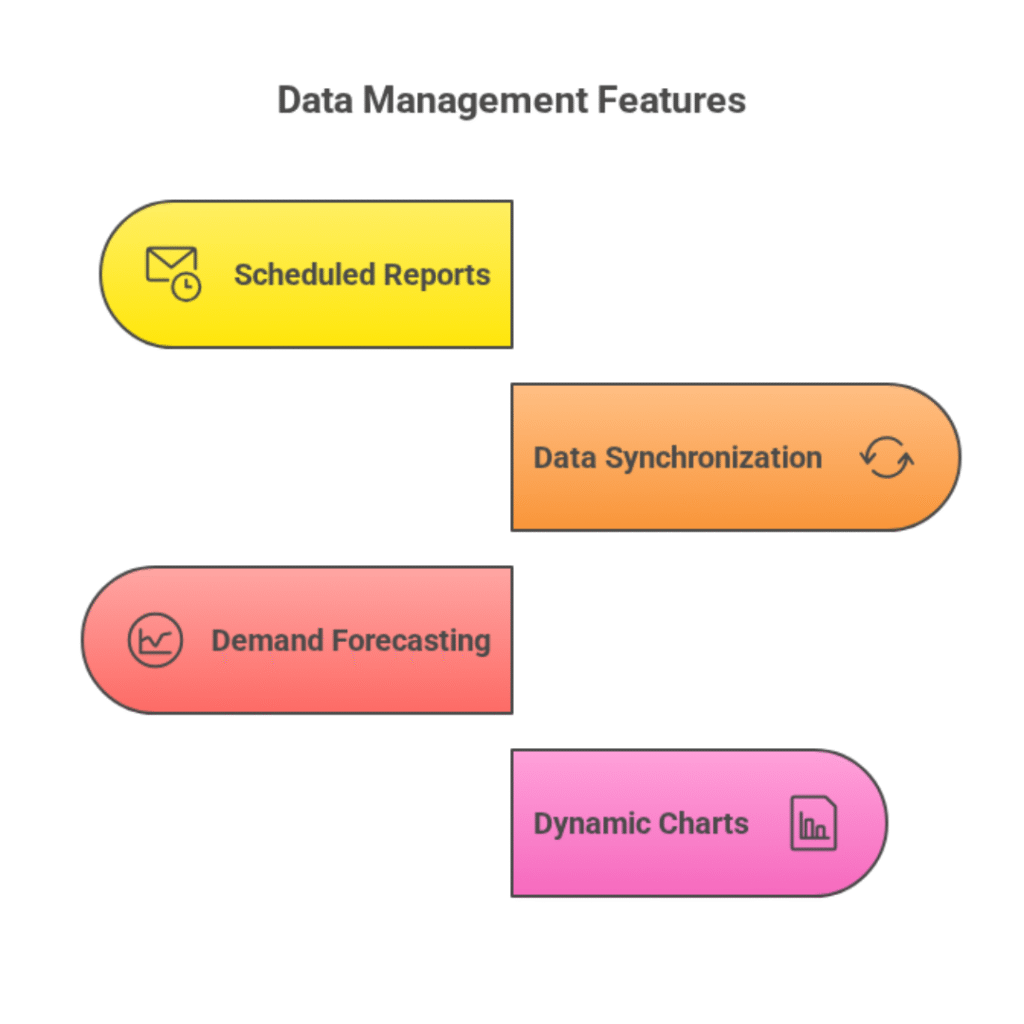
- Quickly schedule your reports for automatic transfer via email.
- Sync your data directly into Google Sheets or Power BI.
- Forecast demand with predictive analysis.
- Access to dynamic charts and cohort analysis.
Thus, automation allows you to grow your Shopify store strategically.
Integrations: Expanding the Power of Your Shopify Website
Data-driven scaling can’t occur in a vacuum. Building a true 360° view of your Shopify site will require optimizing integrations with important platforms such as:
- Marketing Tools: Monitor ad ROI across multiple channels.
- Financial Tools: Sync PayPal and your accounting software.
- Shipping & Fulfilment Partner: Integrate with ShipStation to manage logistics.
- Advanced Analytics Platform: Push data to BigQuery or Power BI for predictive modeling.
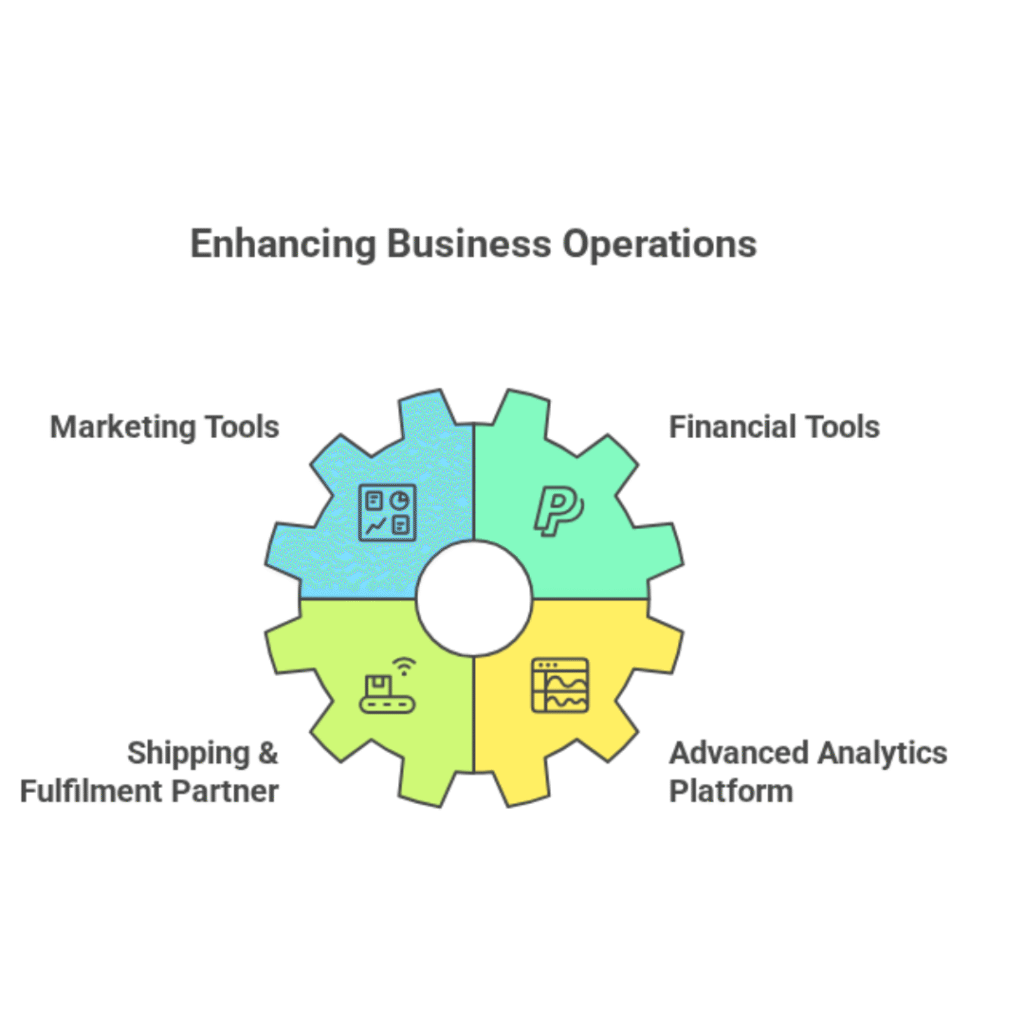
With the help of these integrated platforms, your Shopify store will become the central hub for all critical business insights.
The Competitive Advantage of Data-Driven Decisions
Ecommerce can easily become extremely competitive. Anyone can open a Shopify online store, but not everyone can scale it. By taking actions based on real-time, AI-fueled data, you can ensure the following:
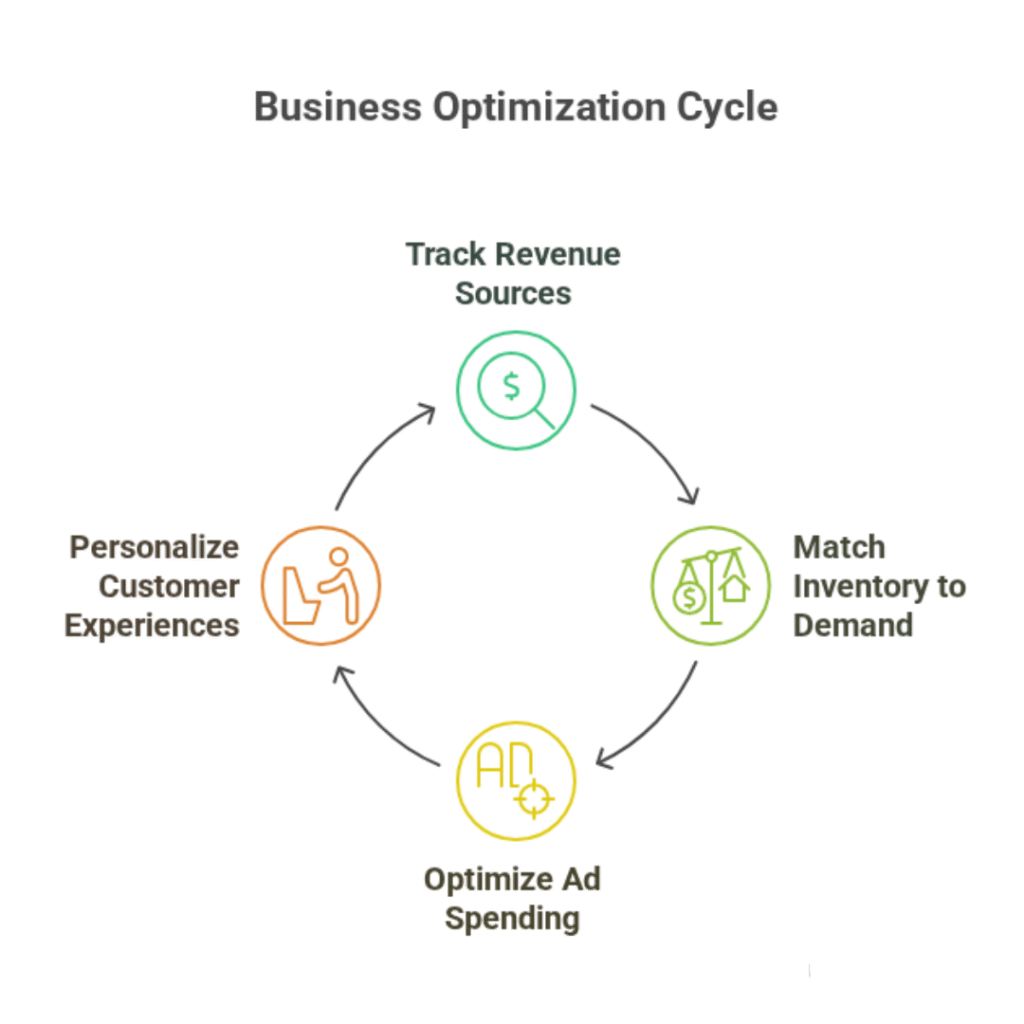
- You always know where your revenue is coming from.
- Your inventory matches customer demand.
- Money is spent on effective ad campaigns.
- Customer experiences are personalized and engaging.
The data-first approach is the separation point of thriving stores and stagnant stores.
Conclusion
Scaling your Shopify online store isn’t defined by more effort, but by better strategies. Data reveals the value in every move you make around stocking products, selecting customers, or expanding to new markets. With the help of apps like ReportGuru, you will unlock the full potential of integrations, automations, and AI data which can guide you into the future.
If you truly want to build your store and transform it into a long-lasting profitable Shopify store, then it’s high time to accept data, believe the data, and grow your Shopify website with confidence because at the end of the day, the only difference between merchants who are struggling and merchants who are succeeding, is that one group is relying on guesswork while the other one is making data-driven decisions.